Home > User Interface > Status > Dashboard

|
Menu path: Status > Dashboard.
Select either Dashboard or System below it to see the summary display of system operation. As a general rule, any graph that is displayed may be further queried by hovering over a location in the graph. A pop-up may appear with further details. When other graphs are displayed with the same time scale, their values are simultaneously highlighted.
Two groups are available at the top of the page:
This page offers graphs time-based graphs for a number of values. Refer to Graph Interpretation for instructions on interpreting and modifying graphic displays.
The graphics are divided into major sections:
Graph Interpretation
Each of the graphs offers common controls legends and controls, shown in the example below.
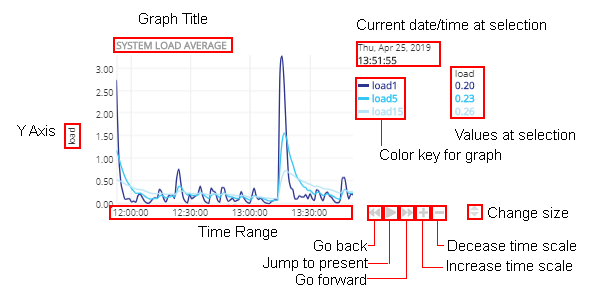
In addition, you may left click and hold on any graph to move the time window back or forward.
Four RADIUS graphs are displayed. See Graph Interpretation for an explanation of graph contents and controls.
The graphs displayed are:
Several captive web portal related graphs are displayed. See Graph Interpretation for an explanation of graph contents and controls.
The graphs displayed are:
Copyright © 2020 Extreme Networks. All rights reserved. Published December 2020.