Home > User Interface > Status > Dashboard

 |
Menu path: Status > Dashboard.
Select either Dashboard or System below it to see the summary display of system operation. As a general rule, any graph that is displayed can be further queried by hovering over a location in the graph. A pop-up can appear with further details. When other graphs are displayed with the same time scale, their values are simultaneously highlighted.
Two groups are available at the top of the page:
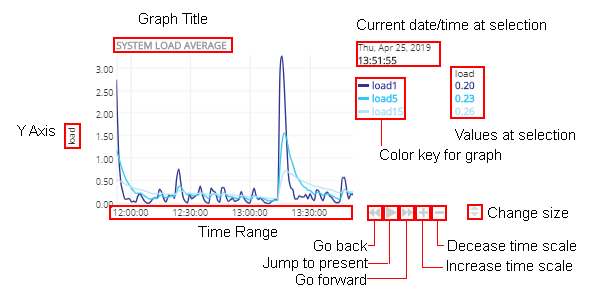
This page offers graphs time-based graphs for a number of values. Refer to Graph Interpretation for instructions on interpreting and modifying graphic displays.
The graphics are divided into major sections:
Graph Interpretation
Each of the graphs offers common controls legends and controls, shown in the example below.

In addition, you can left select and hold on any graph to move the time window back or forward.
Four RADIUS graphs are displayed. See Graph Interpretation for an explanation of graph contents and controls.
The graphs displayed are:
Several captive web portal related graphs are displayed. See Graph Interpretation for an explanation of graph contents and controls.
The graphs displayed are:
The Health tab provides a real-time and historic view of the health of the
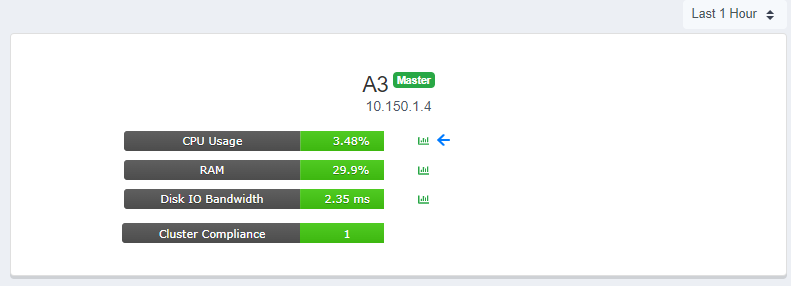
current A3 instance. The first panel is as shown below.
 is displayed if the instance is the master in the cluster.
| Statistic | Value |
|---|---|
| CPU Usage | The instantaneous CPU percentage being used. |
| RAM | The instantaneous RAM usage. |
| Disk I/O Backlog [???] | The instantaneous amount of time that a disk I/O request remains in the queue. Larger values equate to slower disk performance. |
| Cluster Compliance | The number of cluster members that have an up-to-date database. [???] |
 icon to display the graphs. Three panels are displayed for each
statistic. The first two include time and visual control at the bottom right.
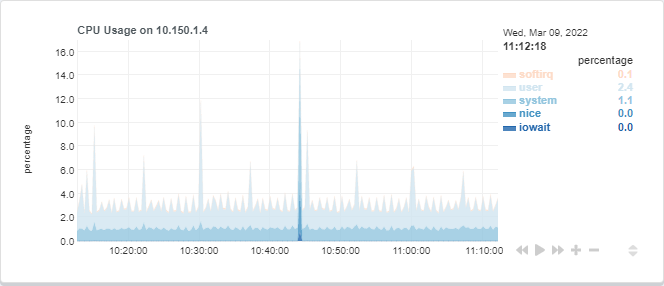
For example, in the first CPU Usage panel shown below, the controls are
  . From left to right, these controls are:
 - move the display back in time.
 - resume real-time display.
 - move the display forward in time.
 - increase the graph scale.
 - decrease the graph scale.
 - select and move the control up and down to change the size of
the panel.


CPU Usage Statistics
| Label | Value |
|---|---|
| softirq | The percentage of time that the CPU is servicing interrupts. |
| user | The percentage of time that the CPU is running user code. This includes the A3 application and related processes. |
| system | The percentage of time that the CPU is running in kernel mode, including device drivers and kernel modules. |
| nice | The percentage of time that the CPU is running in user mode with lower than normal priority. |
| iowait | The percentage of time that the CPU is waiting for an I/O operation to complete and can't be used for anything else. |
RAM Statistics
The statistics shown for RAM Usage are:
| Label | Value |
|---|---|
| free | The amount of memory not assigned. |
| used | The amount of memory used by running processes. |
| cached | The amount of memory used for recently used files. |
| buffers | The amount of memory reserved by the operating system to allocate as buffers when processes need them. |
Disk I/O Backlog
The statistics shown for Disk I/O Backlog are:
| Label | Value |
|---|---|
| backlog | The amount of time that disk I/O had to wait in the disk I/O queue. |
Copyright © 2022 (your brand here) Published May 2022.