Anomaly Information for a Device
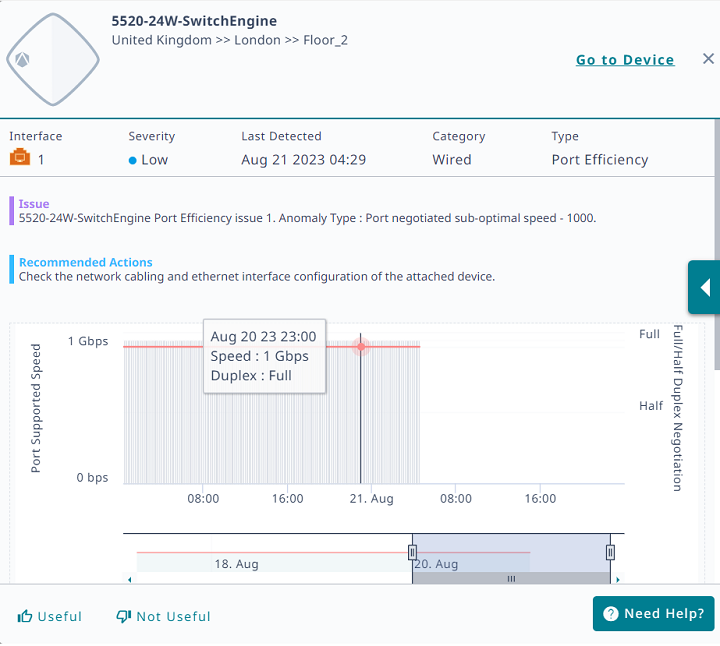
Select a device to open a panel with detailed information about the anomaly, including a description of the issue and recommended actions for resolution. To open the page for the device, select Go to Device.
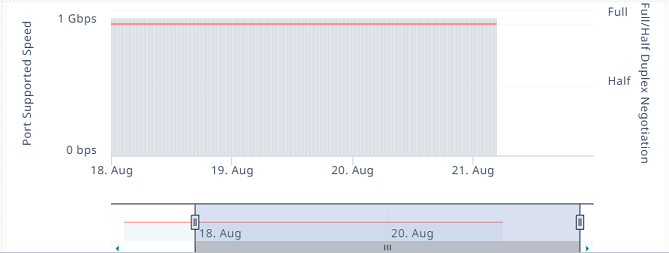
The panel graphs display up to 3 days worth of data, including the 48 hours prior to the time stamp for the last detected anomaly.
Detailed Information

If you find the detailed information helpful, select Useful. If you did not find the information helpful, select Not Useful. To get help, select Need Help.
Select a bar to see details; select a bar and drag along the timeline to show data for a range of time.
Detailed Information for Specific Days

Related concepts

