Home > GUI > Insights > ML Insights Network 360 Plan

|
ML Insights Network 360 Plan
View, plan, add, select, move, modify, clone, export, and delete map (location, building, and floor) objects; import and draw floor plans; and view heat maps. View network health details, plan, add, and modify a network hierarchy; and add Extreme Networks devices to floor plans.
Navigate using the left sidebar tab icons. Hover over an icon to see the name of the tab.
 ML Insights > Network 360 Plan
The Network 360 Plan window is where you create your network hierarchy, which then gives you a detailed visual and geographical representation your network locations (sites, buildings, and floors). Once you have created your network hierarchy, when you onboard devices and assign them to a location, they automatically appear on the location map here.
You can also use this window to place simulated devices to determine where you may need to add or redistribute devices for the best wireless network capability.

Note
Due to the complex factors that can affect radio signals in the real world, Extreme Networks cannot guarantee that actual radio coverage will match the estimated coverage results.The Network 360 Plan window, which consists of a central map and a network hierarchy outline panel on the left contains the following features:
Search Maps: If you have a large network with multiple locations, enter the first few characters of a building or location name in the type-ahead search field above the hierarchy panel to see a list of locations. The more characters you enter, the more precise the search results will be.
Global View: This is the overarching container for all of the locations, buildings, and floors in your network.
Locations: Your networks locations are nested beneath Global View.
Buildings: Buildings associated with a location appear beneath the location name. You can add multiple buildings to a location.
Floors: Floors associated with a building are nested beneath the building name. Import floor plans, or draw floor plans. Tools allow you to add (draw)objects that could impact your wireless functionality (see "Wall Drawing Tools" and "Import Background Images". Use integrated Google maps to create floor plans, import floor plans and maps (.png or .jpg images), or draw floor plans directly on your map using the drawing tools. You can see all of the floors in a building at the same time to understand how the layout of APs on one floor affects devices on adjacent floors.
Note
You can only add floors to buildings, you cannot add floors to locations.The network hierarchy panel contains the following features:
Delete, Move, Export, Clone, Edit, Add and More (...)tools are available to the right of names in the network hierarchy panel
When you open the ML Insights Network 360 Plan tab for the first time, you see the Your Network has No Locations dialog box. Select Add Locations to begin planning your network as described below.
The first step in planning your network is to define your network locations, and then add the buildings and floors. These steps are described below.
Add a Location
Select Add to add a network location. Select Location, complete the name and address fields. The address that you enter here automatically links the location to Google maps. The environment setting influences the sizes of the cells that are displayed. To improve the accuracy of cell sizes, choose an environment type that most closely matches your installation. Select Save.
Add a Building
The building view provides statistics for the total area of RF coverage, the average coverage area for each device, and the total number of devices on each floor. It also allows you to see APs on different floors and their channel selections in relation to one another. Once you have created a location, add a building to the location.
There are three ways to add buildings; in the hierarchy panel, select  next to the name of the location where you want to add the building, or
  at the bottom of the panel. Or select Add Building above the location map.
In the dialog box, enter a name, an address, and associate the building with the location. Select Save.
Next draw a perimeter around your building. Use the Draw Perimeter button to draw the bounding walls and define the RF coverage area.
It is a good practice to define the perimeter before adding walls, windows, doors, and other RF obstructions. The perimeter helps ExtremeCloud IQ estimate how much radio signal passes outside the walls of the building.
Select Draw Perimeter, then select a corner of the building and drag to the next corner. Select and drag to each corner. Before you reach the last corner, either select Close Perimeter, or double click to close the shape and exit drawing mode. To remove a perimeter, right-click a perimeter line and select Remove.
To change the perimeter wall type, right-click the perimeter to highlight it and select Change Wall Type from the menu. Choose an option:
Dry Wall (3 dB) (default)
Brick Wall (10 dB)
Concrete (12 dB)
You can draw multiple perimeters on the same map to define different buildings or buildings with open spaces, such as courtyards. To draw a second perimeter on a map, select Draw Perimeter again and draw the new perimeter. You can draw perimeters inside each other, or two or more non-intersecting perimeters. The only invalid combination is a perimeter that intersects another perimeter.
Add Floors
There are multiple ways to add floors: in the hierarchy panel, select next to the name of a building or select at the bottom of the panel. Or, select Add Floor above the building map. Enter a name for the floor, associate it with a building, and choose an environment. Select Save.
AP Installation Height: Enter the installation height of all APs on the floor. If the height varies from AP to AP, then specifying the average dimension is advisable. ExtremeCloud IQ uses the installation height to help estimate RF coverage of simulated APs more accurately. In general, this setting has only minimal effect on location estimates. The exception is sites such as warehouses where the height of APs mounted on the ceiling or on high crossbeams is substantial.
Map Size: Enter the dimensions for the floor.
Background Image for floor plan: From the drop-down list, choose an image file. For information on loading image files, see "Import Background Images". You can also use the drawing tools to draw a map or floor plan.
When you import a floor plan with a background image, you need to scale the map. Select  in the and then select Rescale Plan. Enter dimensions, or size the image manually using the red cross hairs on the map. Select the width and height and move the cross hairs to the end points of a known distance on the image, such as a standard-sized doorway (2.5 feet or 76 cm). Enter that distance in the field. When you are done, select Apply.
Note
When you toggle between the width and height icons, the cross hairs on the map reposition appropriately.If the position of a floor is offset in relation to the position of other floors in a building, enter values in the Floor Alignment section to indicate the X- and Y-axis offset distance.
Draw Walls
From the Edit Floor Plan tab, you can draw in physical elements of the floors where you plan to deploy APs. Specifying internal obstructions helps ExtremeCloud IQ to estimate the amount of coverage needed for your deployment.
Wall Types: Whether you draw your own floor plan or use an imported image, you can use the drawing tools to add different types of walls and other obstructions commonly found in buildings to the map to replicate the obstruction to RF signals. The number following each obstruction type in the list indicates an estimated amount of path loss in decibels (dB) when the radio signal strikes the object at a 90° angle. Each line type has a different color.
To change the default wall line color and line type assignments, select and then Planning Tool from the drop-down list.
The wall drawing tools include:
 Single Line: Use this tool to draw objects such as doors and windows.
 Open Shape: Use this tool to draw walls and partitions that are joined at corners. Double-click the last drawn point or select the line icon again to exit the tool.
 Closed Shape: Use this tool to draw enclosed areas such as elevator shafts and stairwells. Double-click the last drawn point or select on the line icon again to complete the shape.
To exit a drawing tool, double-click anywhere on the map. To reshape objects and lines, exit the tool, and then select and drag an end point of any line.
To change a wall type, position your cursor on a line segment to highlight it, right-click and select Change Wall Type from the pop-up menu.
To move a wall or object, position your cursor on a line segment to highlight it, right-click and select Move from the pop-up menu. The appearance of the line changes, indicating that you can now move it in the map.
To clone a wall or object, position your cursor on a line segment to highlight it, right-click and select Clone from the pop-up menu. A copy of the original line or object appears on the map.
To remove a line segment, position your cursor on the segment to highlight it, right-click and select Remove from the pop-up menu. To remove all of the walls, select  .
.
Note
You can only modify, move, clone, or remove individual line segments. Even if you drew an object consisting of multiple lines with the open-shape or closed-shape tool, you can only change the wall type or remove the lines of an object one segment at a time.Import Background Images
This option is available when you add buildings and floors to a location. Add one or more image files for use as maps and floors. Once imported, images can be stored in the image library for future use.
To upload image files, in the Edit Floor Plan tab, select Upload Floor Plan. There are two options: Upload New from computer lets you browse to and upload an image directly from your computer or Choose from Library, which lets you choose an existing image from or upload a new image directly to the image library. For best performance, image files should be 500 KB or less, and in .png or .jpeg format.
To review the maps in the image library, from the Edit Floor Plan tab, Upload Floor Plan > Choose from Library, select a file name or image in the list. A preview of the file appears in the window. To delete an image, select the small x in the image thumbnail and confirm the deletion.
The following table describes how to reduce the size of large images, such as floor plans:
| Graphical Description | Step | Description |
|---|---|---|
|
Reduce the image resolution to 72 dpi. |
When the image will be viewed on a monitor, it should be rendered in screen resolution. Although there are many exceptions, most monitors display images at 72 dpi (dots per inch). Converting an image to 72 dpi does not reduce the size of the image, but it does establish the baseline screen resolution for all subsequent steps and ensures that the final image looks its best. |

|
Convert the image to grayscale. |
Removing the color information from an image can reduce its size significantly. For example, converting an uncompressed 24-bit color image to 24-bit greyscale reduces the size by about 1/3. Floor plans can be rendered with as few as two or four bits, and some as 1-bit black-and-white, which reduces the size even more. |
|
Resize the image. |
Resizing re-samples and re-renders the image without changing the resolution. However there is a lower size boundary beyond which an image is unrecognizable. Most re-sampling algorithms maintain the quality of photographs. There may be algorithms that are better for maintaining the quality of non-photo images. |
|
Export the image to .png output. |
Exporting an image as a .png file applies a lossless compression that works well with line drawings, but does not work with most photographs. (Photographs are best compressed using a high-quality JPEG algorithm.) PNG compression allows certain images to be compressed very tightly. |
|
Compress or optimize the .png file. | Because lossless compression is, almost by definition, not optimized, there are tools that can examine a .png file, and further compress it by manipulating bit depth or optimizing the information that actually defines the image. For example, the open source PNGCrush tool. |
Network Maps
The maps that are displayed for each level of your network hierarchy contain tools and information about your network. The following sections describe the tools that are available at each map level (location, building, and floor).
Location Maps
On the top-level map (the network location map) a building icon indicates your network location. The location map contains an Import Map button, an Add Building button, an option to choose between map or satellite view, a zoom option, and an expand screen option. Select the right arrow next to the location name for a drop down list of buildings, devices, alarms, and active clients at the location.
Building Maps
Buildings maps appear when you select a building in the hierarchy. A building map contains a floor plan of the building. Building maps contains Import Map and Add Floor buttons, an expand screen option, and a Details panel, which shows the number of devices, alarms, and active clients at this location. Select any blue text in the expanded Details panel to drill down for more specific network information.
If there are multiple floors in a building, you can toggle between them to see floor plans and device deployment.
Floor Maps
Floor maps appear when you select the floor name in the hierarchy. A floor map should contain at least one floor perimeter and information about the types of walls and obstructions that appear on the floor.
Floor map tabs let you plan and view your network deployments:
Plan Devices
The following options appear at the top of the Plan Devices tab when you are adding a floor:
: Displays the number of devices available to deploy. Use this option to assign real and simulated devices to the floor plan.
: After you select the location wireless coverage type (basic, high-speed, voice, or location tracking), select
Auto Placeto automatically place the devices in the optimal locations for the selected wireless coverage type.
: Manually place devices based on radio band (5 GHz or 2.4 GHz), device model, signal strength, channel, and power. Select
Moreto see additional settings for this function.
Once you have placed simulated devices on a map, or after you have onboarded actual devices, you can view the heat map for all devices.
Assign Devices
To assign actual devices to your floor plans, select Onboard Devices. The dialog box shows simulated devices and managed devices.
Auto Device Placement
From the Auto Plan for section, ExtremeCloud IQ automatically places devices on a map based on the application you select. Choose a service from the drop-down list:
ExtremeCloud IQ automatically adjusts the signal strength for the application you choose, and determines the number of devices required to provide that signal strength. If you choose a signal strength that corresponds to a particular application, ExtremeCloud IQ automatically displays that application in the application drop-down list. Application and signal strength are linked so that choosing either one automatically chooses the other.
Select More for additional settings. Make your selections, and then select Auto Place.
Radio: Select either 2.4 GHz or 5 GHz. The channel selections that are available will change depending on this setting.
Device: Select a device model from the drop-down list.
Manual Device Placement
Use the Add Devices section to manually place simulated devices on your floor plans.
Enter the number of devices you want to place and select More to expand the settings. Make the following selections, and then select Add.
Radio: Select either 2.4 GHz or 5 GHz. The channel selections that are available change depending on this setting.
Device: Select a device model from the drop-down list.
Channel: Set the radio channel that you want the devices to use. Choose Auto to allow ExtremeCloud IQ to set the channel automatically, or set a specific channel manually. Channel options vary depending on the radio band setting.
Power: Set the transmission power for the devices. The range is from 1 to 20 dBm.
Signal Strength: Choose the RF signal strength for your site.
Target coverage is one factor that determines the number of devices ExtremeCloud IQ automatically places on the map. For example, for coverage with a signal strength of -50 dBm, ExtremeCloud IQ places multiple devices on the map to ensure adequate coverage. For a lower signal strength such as -70 dBm, fewer devices are placed on placed on the map.
View Heat Maps
Once your maps are populated with onboarded devices, simulated devices, or a combination of both, you can view device heat maps from the View Heat Maps tab. Heat maps display a wide range of data about your wireless network coverage, including RSSI, SNR, channels, data rates, and interference.
Make the following selections from The View Heat Maps tab:
Radio: Select the 2.4 GHz or 5 GHz band.
Devices: Choose to show heat maps for all devices on a map, only for real devices, or only for simulated devices. If you choose to show only real devices, you can also then show clients, rogues, meshed, and Ethernet devices.
Show on Heat map: Select the type of heat map you want to see. For any option besides None, a panel appears with the multiple floors icon, color bars to explain the colored areas on the map, and a drop-down where you can change the power setting.
For buildings with multiple floors, you can see how the devices in each floor affect the coverage for the other floors. To do this, in any active heat map, select the check box next to  .
.
For any active heat map, you can also change the signal strength that is displayed on the map. Select from a range of -40 dBm to -90 dBm in the dBm drop-down list. The default setting is -70 dBm.
Types of Heat Maps
The following heat maps are available on the View Heat Map tab:
None: Select to clear heat maps.
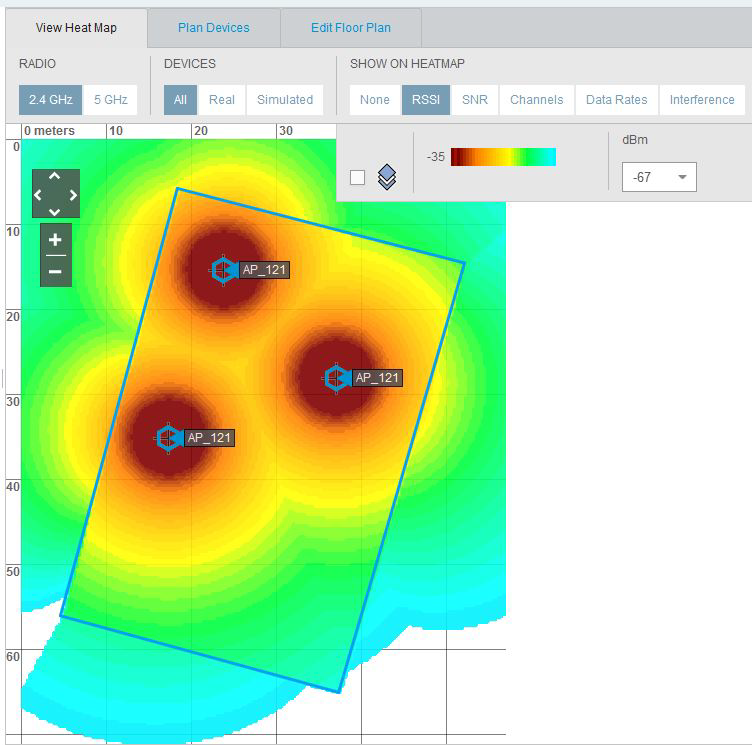
RSSI: The RSSI color bar indicates the strength of the signals, with red being the strongest and light blue the weakest. When you raise the signal strength threshold toward -40 dBm, the color bar shows only colors representing signal strength levels strong enough to pick up clients at or above that threshold. When you lower the threshold closer to -90 dBm, the color bar shows more colors, indicating more signal strength levels at which clients can connect.
Hover your cursor over the color bar to see the RSSI values represented by colors.
This illustration shows an example of an RSSI heat map.
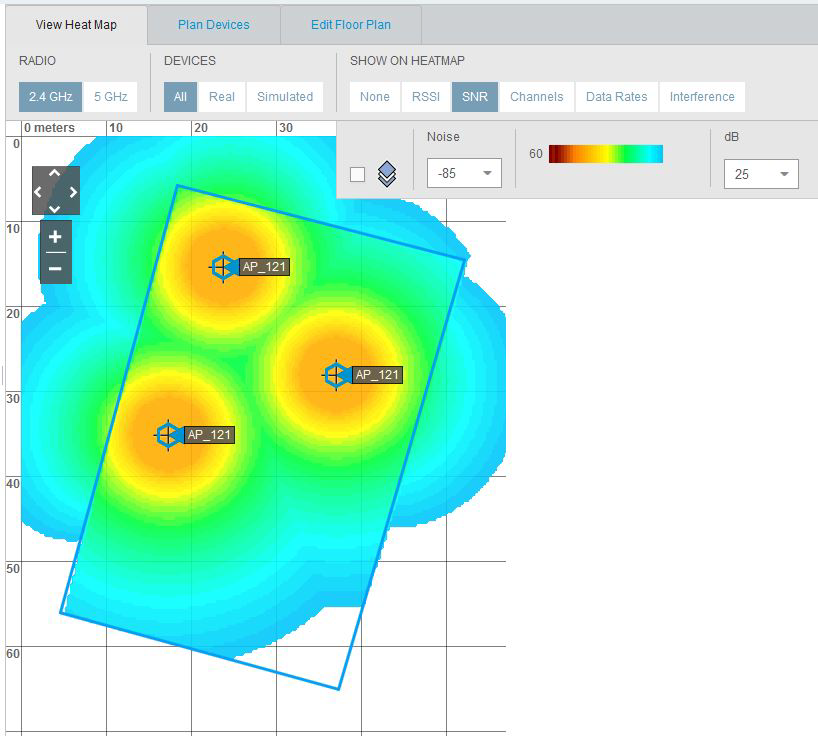
SNR: SNR (signal-to-noise ratio) is the difference between the RSSI and the noise level in the RF environment. A high SNR means that the difference is high, and the potential for interference is slight. Conversely, a low SNR means that the received signal is closer to the noise level, with a greater potential for interference. Generally, the greater the SNR, the higher the data rates, and the better the quality of the wireless link. For good wireless performance, the SNR should be at least 25 dB and never lower than 20 dB.
Set an SNR threshold and a noise level from the drop-down lists. Then select SNR to simulate different noise levels from -95 to -75 dB to see how varying amounts of noise affects the range at which the SNR threshold level can be achieved.
This illustration shows an example of an SNR heat map.
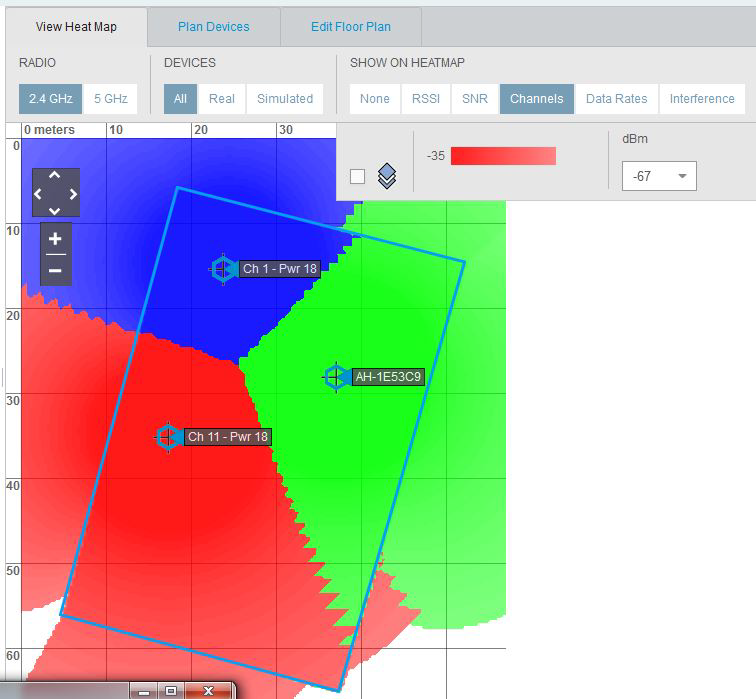
Channels: ExtremeCloud IQ dynamically assigns channels when you add AP icons manually or when you use the automatic placement method. Channels appear in different colors so that you can easily identify which channels the APs are using. The colors are gradients, radiating from a solid core outward toward an increasingly transparent perimeter. You can adjust the lower end of the RSSI range to change the area of coverage depicted.
Channels and RSSI heat maps both display channel and RSSI values. The difference is in the emphasis that each places on different types of data. The Channels option also shows RSSI data, but uses a single color per AP to make it easier to see which channels are in use in any area. The RSSI option also shows channel data, but uses of different colors to make it easier to distinguish RSSI values.
This illustration shows an example of a channel heat map.
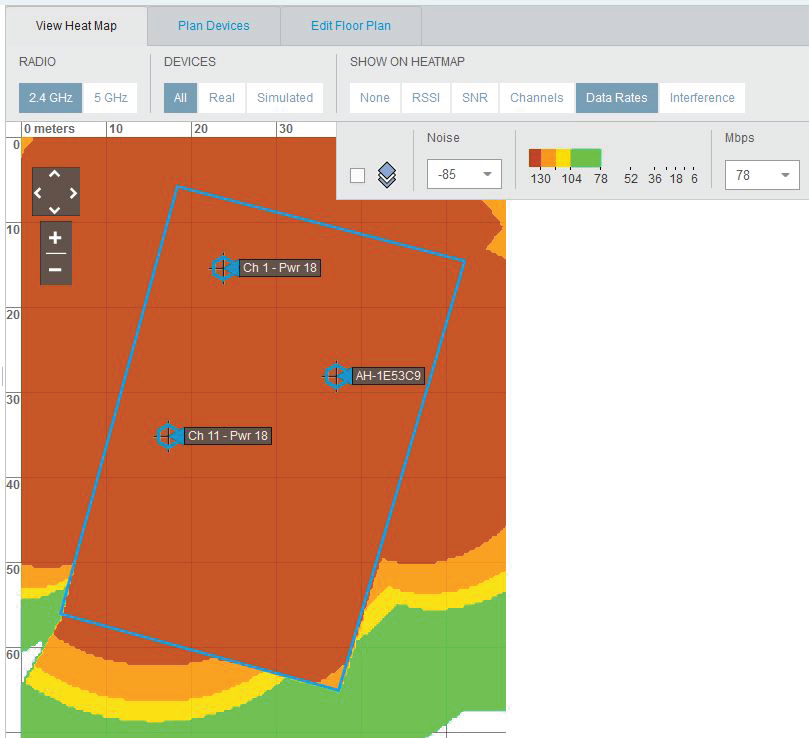
Data Rates: Set the minimum data rate that you want the APs to provide. Radio cells are colored to show the estimated data rates that are available at various distances from the AP. The colors cover a range from the minimum data rate to a maximum of 270 Mbps.
Note
Data rates above 54 Mbps are only possible when the radio mode is 802.11n.
Choose the estimated noise level of the site from -75 to -95 dB in increments of 5 dB to estimate the amount of interference to the RF signal from the APs.
This illustration shows an example of a heat map for data rates.
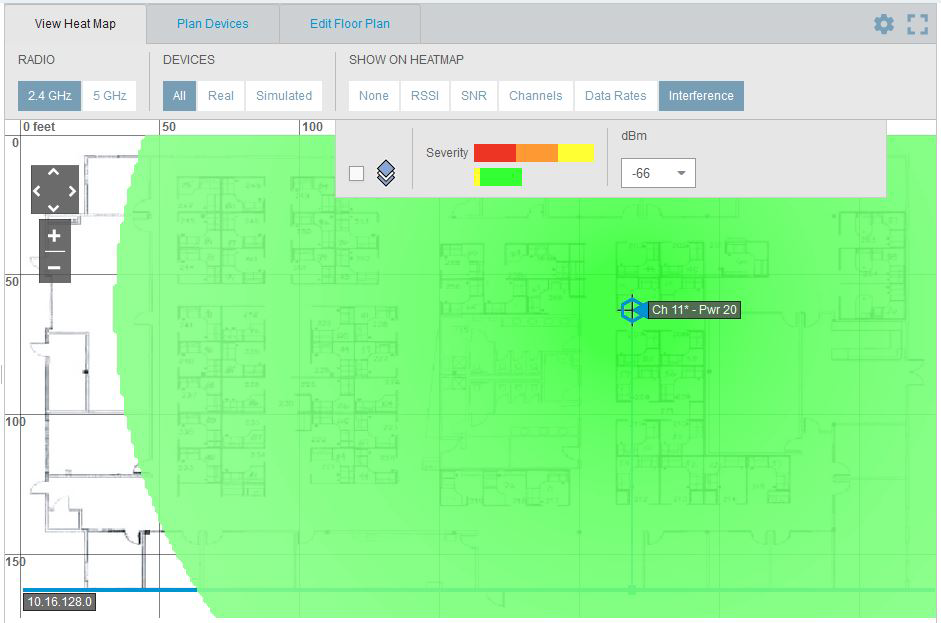
Interference: Identify sources of interference from obstructions inside your building, other electronic devices, or from other wireless networks located nearby. There are many causes of interference, such as microwave ovens, cordless phones, Bluetooth devices, wireless video cameras, and even fluorescent lights. For networks where there is a great deal of interference, you can try relocating devices, changing the power levels, and changing the radio band.
This illustration shows an example of a heat map for interference.
Copyright © 2020 Extreme Networks. All rights reserved. Published March 2020.