Application Visibility
The primary goal of Application Visibility is
to understand application usage and performance over the entire network.
To reach that goal, applications are classified in Application Groups
(AGs), and each AG has specific QoS performance objectives (nominal bandwidth
per session and two thresholds, maximum for one-way-delay,
jitter, packet loss, RTT, SRT and TCP retransmission ratio), thus allowing
to check whether performance objectives are met or not, and to calculate an
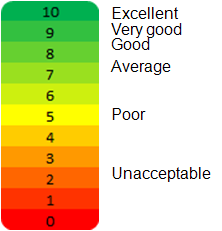
Experience Quality Score (EQS) accordingly.
Application Visibility is:
|
•
|
comprehensive (see the list of metrics below), |
|
•
|
highly accurate, relying on time synchronization from the
network, |
|
•
|
very precise and non-intrusive: measurements are made on the
actual data packets and not on test packets nor simulated flows, |
|
•
|
exhaustive: all IP packets are measured, |
|
•
|
independent from the operator network access and core technology
(measurements are made at the IP layer level), |
|
•
|
confidential: the contents of user packets are not, at any
time, stored, saved or even transmitted between the different system components. |
Application Visibility provides the
following metrics:
|
•
|
the number of packets and bytes transmitted and received, |
|
•
|
the number of sessions, |
|
•
|
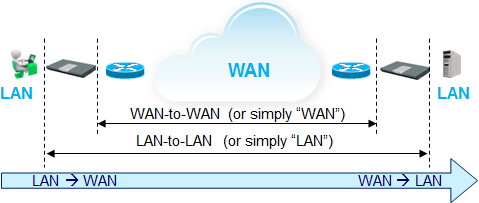
the following one-way metrics: |
all three (called D/J/L) in both:
|
•
|
ingress (from the LAN to the WAN) and |
|
•
|
egress (from the WAN to the LAN), |
both:
|
•
|
between the LAN interfaces of the appliances (LAN-to-LAN metrics,
simply called LAN) and |
|
•
|
between their WAN interfaces (WAN-to-WAN metrics, simply called
WAN): |
|
•
|
the following TCP metrics: |
|
•
|
SRT (Server Response Time), |
|
•
|
TCP retransmission ratio, |
|
•
|
the following composite metrics: |
|
•
|
Voice MOS (Mean Opinion Score), |
|
•
|
all flow EQS (Experience Quality Score). |
Individual measurements are aggregated and analyzed according to multiple
criteria (source and destination sites, source and destination subnets, Application
Groups, applications, etc.). The results are presented in the form of detailed
flows lists, real-time graphs, charts, etc., and archived with periodic aggregations. They are made available for
subsequent processing or reference, and can be used to generate alarms, analyze
long-term trends, forecast future traffic increase to estimate optimum network
sizing, etc.
Users can specify their own aggregation criteria, thus taking into account
their enterprise organization (e.g. the different countries, departments,
services, etc.).
Time Synchronization
Appliance synchronization for the Client is used for correlation, hence for Delay/Jitter/Loss measurement.
Monitoring
The Monitoring dashboard function provides a real-time view of the
performance and activity of the observed traffic through graphs.