Frames and Timing
The frames in the different views can be expanded or collapsed by clicking on their headers (grey bars).
The following example illustrates a Site view with one frame expanded and all other frames collapsed.
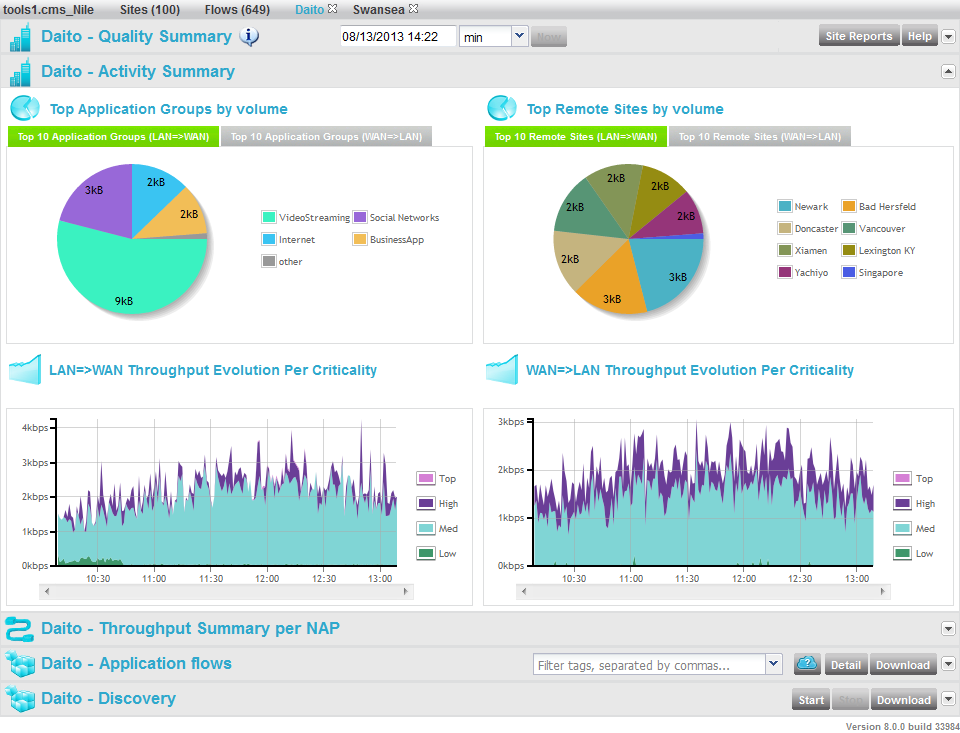
The first frame header of each view (at the top of the main space, just below the menu and view bar) contains, after the name of the frame:
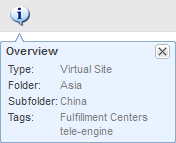
| • | a tooltip |
| • | a date and time area 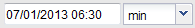 : allows searching historical data
(up to the last 4320 minutes of data) by clicking on this area and scrolling
in the past in the pop-up calendar that opens; : allows searching historical data
(up to the last 4320 minutes of data) by clicking on this area and scrolling
in the past in the pop-up calendar that opens; |
| • | a drop-down list: allows choosing the time span: |
| • | min: evolution quadrants display 3 hours of per minute* information and you can scroll in the past; the flows list displays values averaged over one minute*, |
All views (unless frozen) are automatically refreshed every minute*.
Note: * The period can also be 5 or 15 minutes, if the Collect period has been set to 5 or 15 minutes respectively.
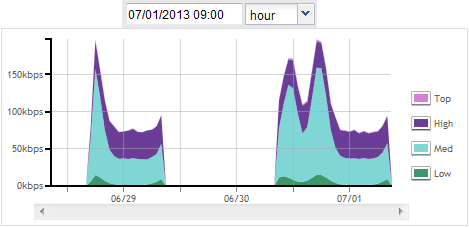
| • | hour: evolution quadrants display up to 3 days of hourly aggregated information; the flows list displays values averaged over one hour; |
All views (unless frozen) are automatically refreshed every hour.
Throughput Evolution quadrant, with time span: hour
Note: The lifetime of the data and the ability to aggregate hourly data depend on the Storage Parameters.
| • | a button to set the date and time to Now and unfreeze the view (the view is frozen when a date and time have been selected; the button is greyed when clicked); |
| • | a |