Real Time Graphs
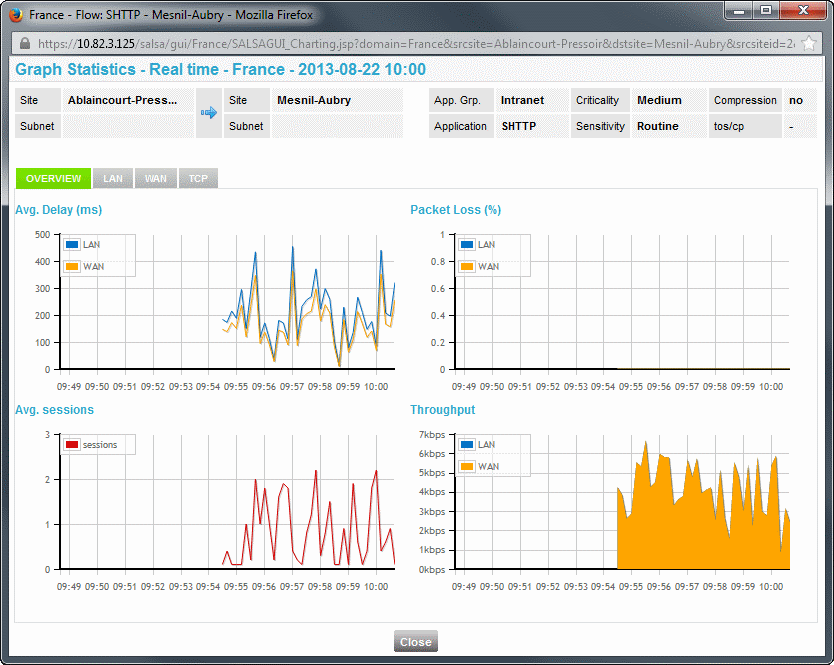
From any flow in the Detailed flows list described above, you can open a Real Time Graph which is a 12-minute window showing the evolution of the above metrics with additional polling every 10 seconds. You can open up to four graphs simultaneously.
To access the Real Time Graphs, right click on a flow and select Start Real Time Graph:

Note: Pop-up windows must not be blocked in your web browser.

A Real Time Graph is empty when it starts. You can see some data after 10 to 20 seconds.
The graph window contains four tabs, and each tab is made of 4 graphs, displayed simultaneously:
|
Tab |
Graphs |
What is shown |
|---|---|---|
|
Overview |
Avg. Delay (ms) |
LAN-to-LAN (in blue) and WAN-to-WAN (in orange) average delays |
|
|
Packet loss (%) |
LAN-to-LAN (in blue) and WAN-to-WAN (in orange) packet losses |
|
|
Avg. sessions |
Average number of sessions |
|
|
Throughput (kbps) |
LAN-to-LAN (in blue) and WAN-to-WAN (in orange) Throughputs |
|
LAN |
Delay (ms) |
LAN-to-LAN maximum (in red), average (in blue) and minimum (in green) delays |
|
|
Packet loss (%) |
LAN-to-LAN packet loss |
|
|
Jitter (ms) |
LAN-to-LAN jitter |
|
|
Throughput (kbps) |
LAN-to-LAN layer 3 (in blue) and layer 4 (in green) throughputs |
|
WAN |
Delay (ms) |
WAN-to-WAN maximum (in red), average (in blue) and minimum (in green) delays |
|
|
Packet loss (%) |
WAN-to-WAN packet loss |
|
|
Jitter (ms) |
WAN-to-WAN jitter |
|
|
Throughput (kbps) |
WAN-to-WAN layer 3 throughput |
|
TCP |
SRT (ms) |
Maximum (in red), average (in blue) and minimum (in green) Server Response Time |
|
|
RTT (ms) |
Maximum (in red), average (in blue) and minimum (in green) Round Trip Time |
|
|
Retransmission (%) |
TCP retransmissions |
|
|
Throughput (kbps) |
Layer 3 (in blue) and layer 4 (in green) TCP throughputs |
Note: In case of control and/or compression, the differences between LAN and WAN values may be very different.
Exporting the graphs
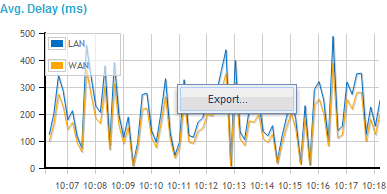
By right-clicking any graph, you display a contextual menu enabling you to export the graph, either as a graph (PNG format) or as raw data (CSV format):

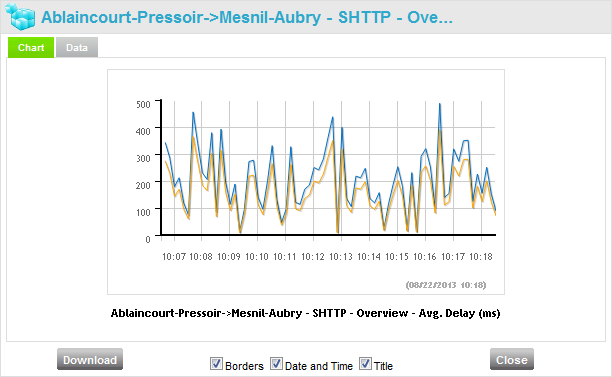
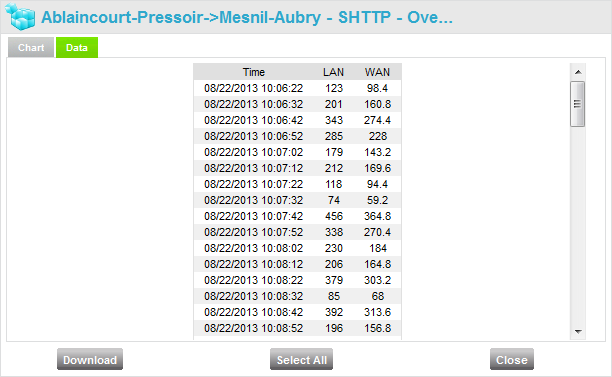
The frame that opens has two tabs:
| • | Chart, allowing to download the graph as a PNG image: |

Three check boxes allow displaying or hiding the Borders, the Date and Time and the Title.
| • | Data, allowing to download the graph as CSV data: |
