WANs and Applications
For the selected Site, this frame displays 2 sets of graphs, one set showing throughput evolution and site connectivity on each WAN, and the other set of graphs showing the throughput per Application Group/Application with its EQS.

The covered period and the granularity of the data in the graphs depend on the time span. It can be three hours of per-minute information if the time span is the minute (you can scroll the past hours with the horizontal scroll bar at the bottom of the graph), or it can be the last three days of hourly average information, if the time span is the hour.
The Connectivity graphs show the connectivity state of the available WANs. They can take four colors:
| • | green: 100% of connectivity |
| • | yellow: 80%-99% |
| • | red: < 80% |
| • | grey: not measured |
Exclamation marks indicate problem of stability (i.e. more than two changes during a collect).
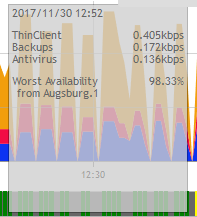
Connectivity problems are indicated in the pop-up when pointed with the mouse:
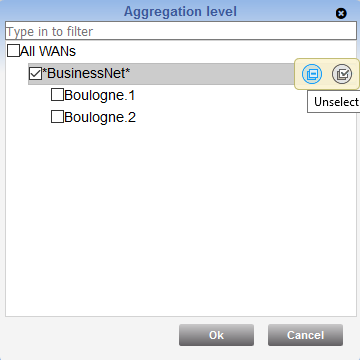
It is possible to show the graphs WAN by WAN (default view) or aggregated for all WANs, or for some WANs only, with a click on the arrow before Select WAN followed by a click on one of the WAN names. Modify your selection in the popup window through the Select Siblings/Unselect Siblings button and click OK to validate.
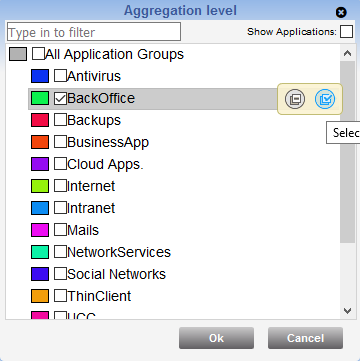
Similarly, you can display the graphs for all Application Groups (default view) or for some Application Groups only, with a click on the arrow before Select Application Group followed by a click on one or several Application Group name(s) in the popup window. If you selected one Application Group, you can use the Select Siblings button to select again all the Application Groups. Click OK to validate.
You can also check the Show Applications checkbox to optimize your selection and select some applications. Through the Select Siblings button, you can select all the Applications in one Application Group. Click OK to validate.
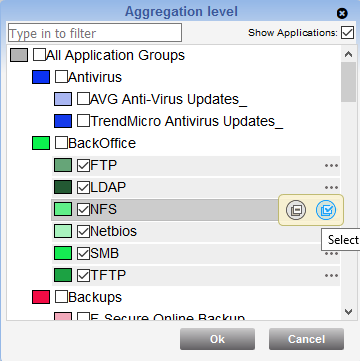
As a result, the graph shows the distribution of the selected Application Groups or Applications on each selected WAN.
Hit the![]() icon in the upper right corner of the frame to modify your display through the following options:
icon in the upper right corner of the frame to modify your display through the following options:

| • | Traffic: select traffic direction from the LAN to the WAN or from the WAN to the LAN. The 'Sum' option displays both direction. |
| • | Scale: if you select the 'Volume' option, throughput is specified in kilobits per second. If you select the 'Proportion' option, throughput is specified in percentage of the volume, with respect to the Y left axis. |
| • | Link Capacity: if the 'Yes' option is available, it displays a limit line which corresponds to the maximum capacity of the link. |
| • | Connectivity: either select 'Local' site connectivity or 'End to End' site connectivity. The status bar at the bottom of the graph differs accordingly. |
| • | Panel height - number of graphs: according to the number of available WANs, you may define the number of graphs to display. The default option is 2. WAN graphs are displayed in alphabetical order. |
Also note that you can select a Remote Site from the drop-down list.
In the following example, there is only one selected WAN:
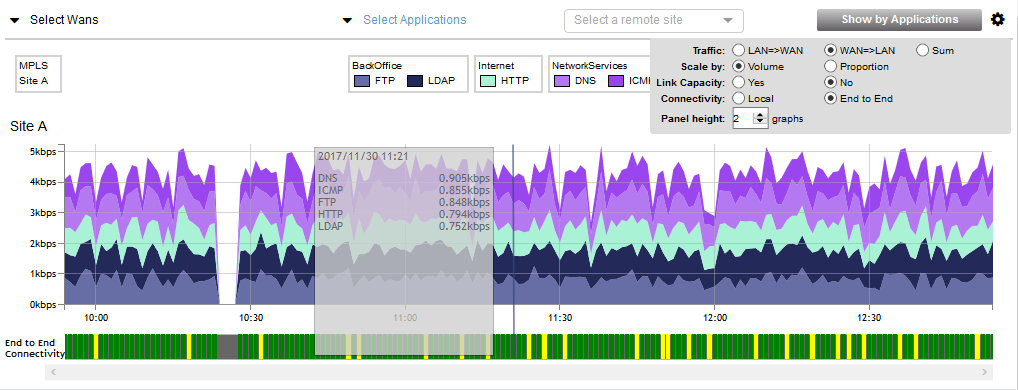
The Show by Application Groups button toggles the view and shows the throughput per Application Group and its EQS. Note that this button appears if you only selected Application Groups without Applications.
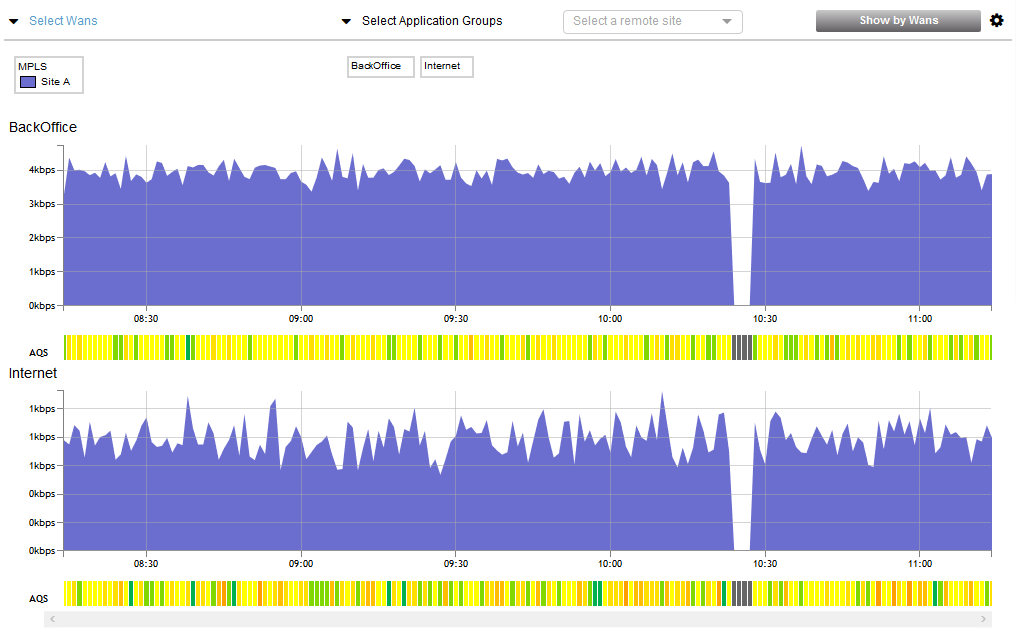
The Show by Applications button appears if you selected Applications.
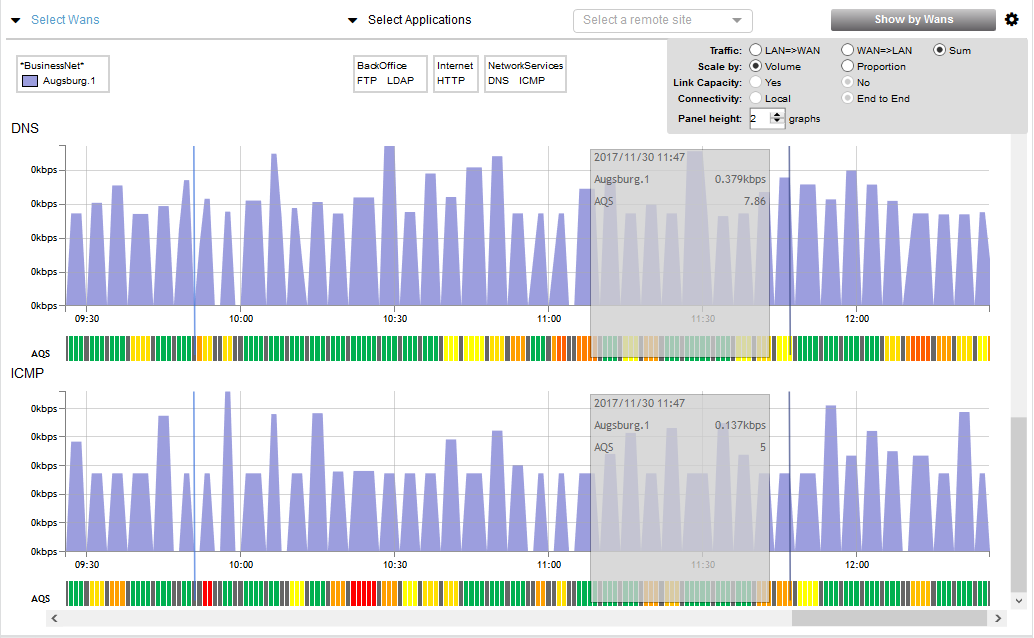
So instead of showing the distribution of the selected Application Groups or Applications on each WAN, this view shows the throughput evolution of the selected WANs for each selected Application Group or Application.
Hit the![]() icon in the upper right corner of the frame to modify your display as explained before.
icon in the upper right corner of the frame to modify your display as explained before.
The Show by WANs button toggles back to the previous view.
Also see "WANs and Applications" for the Client.