Viewing Event History
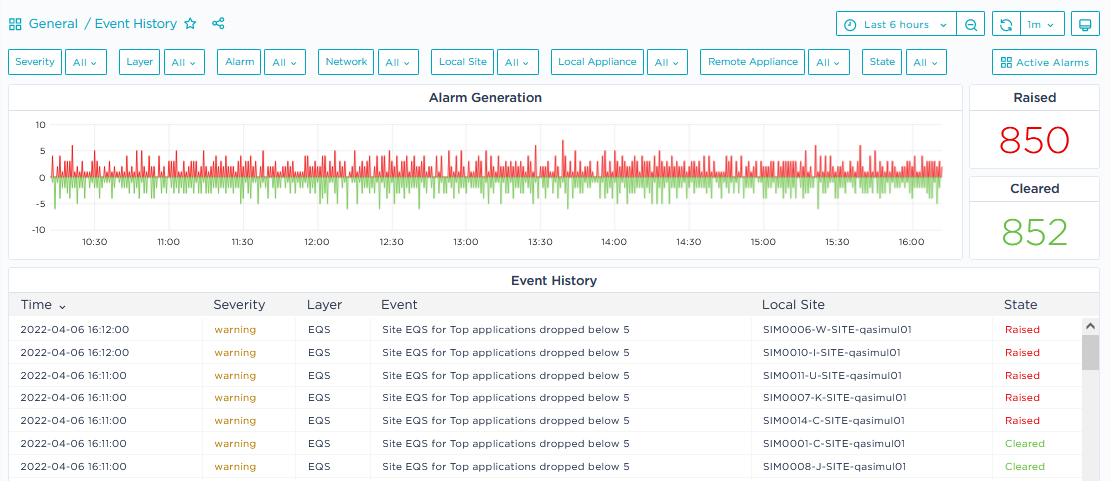
Select the Supervision -> Event History function from the SD-WAN Orchestrator main menu to display the following dashboard. You can also access this dashboard by clicking the  button in the top right corner of the Active Alarms dashboard. Navigating between the Active Alarms and Event History dashboards enables you to keep the defined time range and filters.

| • | The first pane of the dashboard displays the time series graph of the Raised and Cleared alarms during the selected Time Range. |
Note: The Event History Time Range cannot exceed the last 15 days. The Relative Time Ranges higher than 15 days which are available from the Time Range selector are useless. To avoid blank data, use the Absolute Time Range option and enter 'now-15d'; then click Apply.
The counters at the right of the panel show the number of Raised and Cleared alarms for the whole Time Range. Position the cursor on a point of the graph to display, through a tooltip, the number of alarms at a specific time in the time range.
| • | The second pane of the dashboard lists the Critical, Warning and Information alarms raised or cleared at the specified Time during the selected Time Range. The State field identifies the event, i.e. whether the alarm is still raised/active, already cleared, updated (the error code has changed) or logged (there is a change in VRRP configuration). |
Also see how to navigate the dashboard.