Predefined Dashboard Categories
Viewing the list of predefined dashboard categories
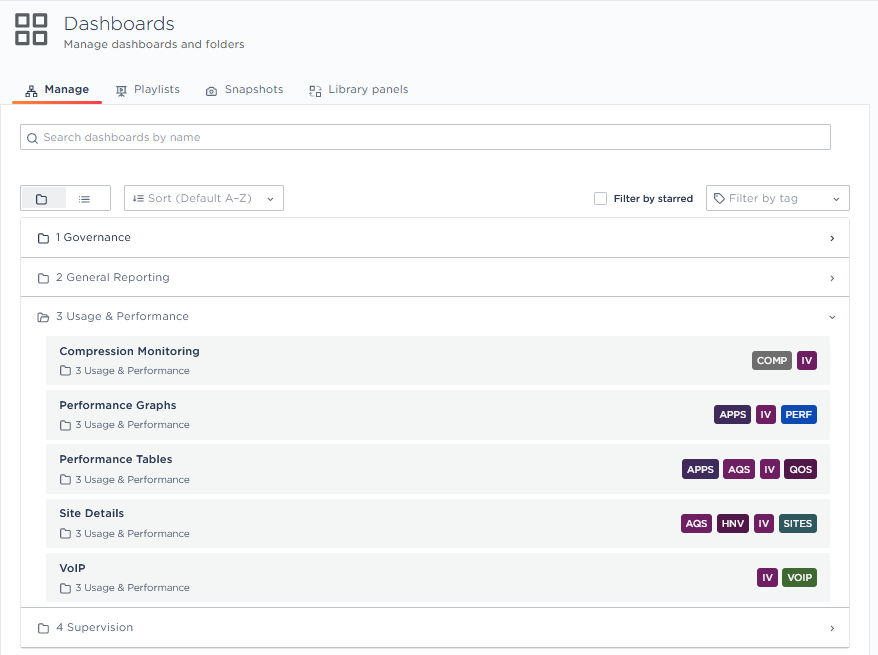
In the Reporting toolbar at the left of the window, click the ![]() icon and select the Manage function. The list of predefined dashboard categories is displayed.
icon and select the Manage function. The list of predefined dashboard categories is displayed.
| • | 1 Governance dashboards provide information such as access congestion, application distribution, capacity planning and enable you to study the interaction between the SD-WAN Orchestrator and your network. These dashboards are designed for long-term decision-making by management. |
| • | 2 General Reporting dashboards provide an overview of your main applications and sites. |
| • | 3 Usage and Performance dashboards display low-level object indicators enabling troubleshooting. |
| • | 4 Supervision dashboards enable you to monitor the appliance infrastructure. |
From the Dashboard List
Select the dashboard from the right category in the list.
You can also filter that list by
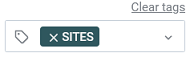
| • | using tags in order to limit your selection choice. For example, if you select the Sites filter, only the dashboards displaying Site information are listed, |
| • | typing the name of the dashboard in the Search field at the very top of the window. Again, the list adjusts to your request. |

Finally, click the appropriate dashboard name to display the dashboard.
From a specific dashboard
| • | Click the first element of the dashboard title to display the list of dashboards in the same category. For example, in 'General Reporting / Overview', click 'General Reporting'. |
| • | Click the second element of the dashboard title, i.e. 'Overview' to display the list of dashboard categories. |
| • | In any case, use 'Go to Folder' to navigate. |
Meaning of some symbols and metrics
Here is a definition of the symbols and specific metrics that are used in the dashboards. For a definition of the standard metrics, such as EQS, Delay, Jitter, packet Loss, RTT, SRT, TCP retransmission, etc., refer to "Application Flows - Detailed flows list"
|
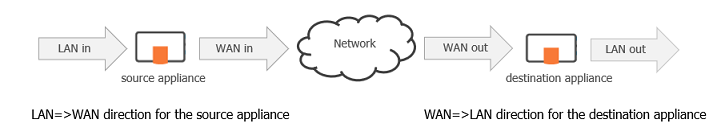
LAN=>WAN |
LAN=>WAN represents the direction of the flow(s) in relation to the selected Site, i.e. coming from its LAN and going to its WAN (alias ingress or outbound or upload) |
||||||
|
WAN=>LAN |
WAN=>LAN represents the direction of the flow(s) in relation to the selected Site, i.e. coming from its WAN and going to its LAN (alias egress or inbound or download) |
||||||
|
Session |
A session is identified:
|
||||||
|
MOS (1 to 5) |
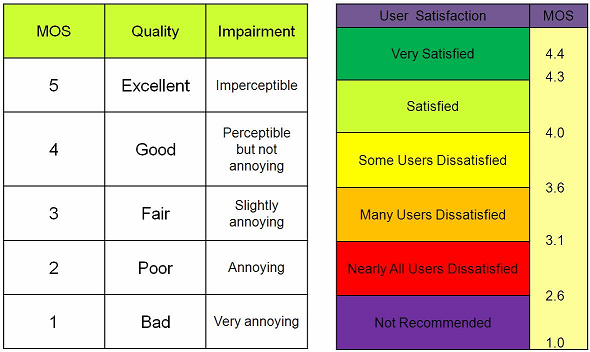
|
LAN and WAN Metrics
Reporting dashboards contain graphs and tables displaying both application and network information.
As a general rule,
| • | the metrics in graphs and tables related to applications are LAN metrics |
| • | the metrics in graphs and tables related to networks are WAN metrics |
For this reason, the volumes provided in the dashboards with both application and network data are calculated differently according to whether they are LAN side metrics or WAN side metrics.