WAN
You can access the WAN page by clicking ![]() in the left main menu of ExtremeCloud SD-WAN or in the WAN widget on the Dashboard.
in the left main menu of ExtremeCloud SD-WAN or in the WAN widget on the Dashboard.
Time Range Selector and Timeline
These display parameters are visible at the top of the WAN page and apply to the displayed data.
| 1 | Select a Time Range period by selecting it from the list : Last Day (default), Last Week, Last Month, Custom. |
| 2 | According to the chosen time range, the Time Span selectors listed below are displayed at the right side of the Time Range Selector. Use these selectors to modify the time span of the displayed data: |
1hour, 2 hours, 4 hours, 8 hours, 24 hours, 1 day, 2 days, 7 days, 14 days, 30 days, 90 days
You can customize the time span by defining the date and time manually.
| 3 | A Timeline evolution graph, showing Throughput, EQS and Raised Alerts curves, corresponds to the chosen Time Range. Position you cursor over any point of the evolution curves to view the Throughput, EQS and Raised Alerts values at a specific time. |
| • | Click every curve label to either display or hide the curve. |
| • | You can either show or hide the timeline. |
| • | You can zoom the timeline curves by dragging your mouse over a specific time range; click  to return to the default time settings of the curves. to return to the default time settings of the curves. |
| 4 | Click  to reset the WAN page to its default time settings (Last Day, 24 hours). to reset the WAN page to its default time settings (Last Day, 24 hours). |
Overview
The WAN -> Overview dashboard is an overview of Throughput and EQS per WAN Service during the last 24 hours (default time range of this dashboard). It displays the following graphs:
| • | Throughput and EQS per WAN Service (bar chart and line chart) |
WAN Services
This table lists the WAN Services of your network with the traffic metrics explained in "Application Flows".
| • | Use the  button to filter data display by Source Site, Destination Site, Source WAN Service or Destination WAN Service, Application, Application Group, Criticality and Source WAN Interface. Select the appropriate elements and click Apply Filters to validate. You can clear the defined filters at any time. button to filter data display by Source Site, Destination Site, Source WAN Service or Destination WAN Service, Application, Application Group, Criticality and Source WAN Interface. Select the appropriate elements and click Apply Filters to validate. You can clear the defined filters at any time. |
| • | Click  to search for a specific element. to search for a specific element. |
| • | Click  to download the table data as a to download the table data as a Wan_Overview_Data.csv file. |
Networks
This dashboard contains outbound and inbound traffic EQS and availability metrics you need to troubleshoot any issues occurring on your WAN Services.
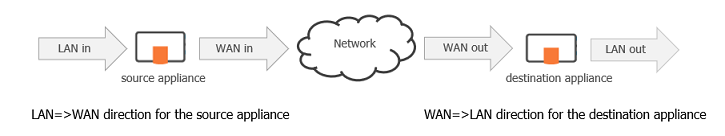
Meaning of some symbols and metrics
|
Outbound |
Outbound represents the direction of the flow(s) in relation to a selected Site, i.e. coming from its LAN and going to its WAN (alias LAN => WAN or ingress or upload) |
|
Inbound |
Inbound represents the direction of the flow(s) in relation to a selected Site, i.e. coming from its WAN and going to its LAN (alias WAN => LAN, or egress or download) |
LAN and WAN Metrics
Dashboards contain graphs and tables displaying both application and network information.
As a general rule,
| • | the metrics in graphs and tables related to applications are LAN metrics |
| • | the metrics in graphs and tables related to networks are WAN metrics |
For this reason, the volumes provided in the dashboards with both application and network data are calculated differently according to whether they are LAN side metrics or WAN side metrics.