Health

The Health screen displays the overall performance of the controller or service platform managed network (system). This includes device availability, overall RF quality, resource utilization and network threat perception.

To display the health of the managed network:

  1. Select the Statistics menu from the Web UI.
  2. Select the System node from the left navigation pane.
  3. Select Health from the left-hand side of the UI.
    Click to expand in new window
    Statistics - System - Health Screen
    ../images/statistics_system_system_health_wc_only.png
  4. The Devices table displays the total number of devices in the controller or service platform managed managed network. The pie chart is a proportional view of how many devices are functional and currently online. Green indicates online devices and red offline devices detected within the managed network.
  5. The Offline Devices table displays a list of devices in the controller managed network that are currently offline.

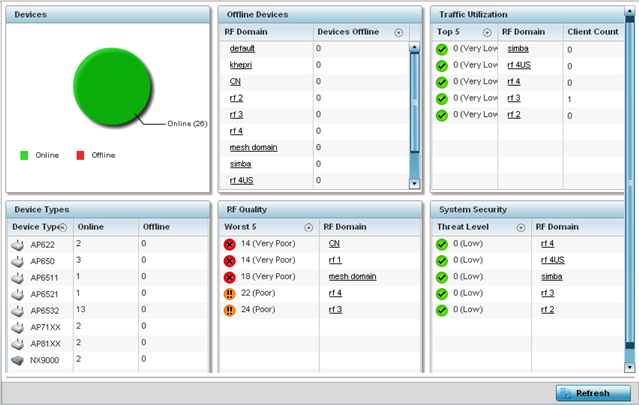
    The table displays the number of offline devices within each impacted RF Domain. Assess whether the configuration of a particular RF Domain is contributing to an excessive number of offline devices.

  6. The Traffic Utilization table displays the top 5 RF Domains with the most effective resource utilization. Utilization is dependent on the number of devices connected to the RF Domain.
    Top 5 Displays the top 5 RF Domains in terms of usage index. Utilization index is a measure of how efficiently the domain is utilized. This value is defined as a percentage of current throughput relative to the maximum possible throughput. The values are:
    • 0-20 – Very low utilization
    • 20-40 – Low utilization
    • 40-60 – Moderate utilization
    • 60 and above – High utilization
    RF Domain Displays the name of the RF Domain. Each listed RF Domain can be selected to display device membership and performance data in greater detail.
    Client Count Displays the number of wireless clients associated with the RF Domain.
  7. The Device Types table displays the kinds of devices detected within the system. Each device type displays the number currently online and offline.
  8. Use the RF Quality table to isolate poorly performing radio devices within specific controller managed RF Domains. This information is a starting point to improving the overall quality of the wireless controller managed network. The RF Quality area displays the RF Domain performance.

    Refer to the following table for details:

    Worst 5 Displays five RF Domains with the lowest quality indices in the wireless controller managed network. The value can be interpreted as:
    • 0-50 – Poor Quality
    • 50-75 – Medium Quality
    • 75-100 – Good Quality
    RF Domain Displays the name of the RF Domain wherein system statistics are polled for the poorly performing device.
  9. The System Security table defines a Threat Level as an integer value indicating a potential threat to the system. It is an average of the threat indices of all the RF Domains managed by the wireless controller or service platform.
    Threat Level Displays the threat perception value. This value can be interpreted as:
    • 0-2 – Low threat level
    • 3-4 – Moderate threat level
    • 5 – High threat level
    RF Domain Displays the name of the target RF Domain for which the threat level is displayed.
  10. Select Refresh at any time to update the statistics counters to their latest values.