Each of the following conditions triggers a hardware health anomaly.
| Condition | Threshold |
|---|---|
| Non-user initiated reboots | More than 5 in 1 hour |
| Non-user initiated reboots | More than 10 in 24 hours |
| CPU utilization | Average CPU usage greater than 90% for 10 minutes |
| Memory usage | Average memory usage greater than 90% for 10 minutes |
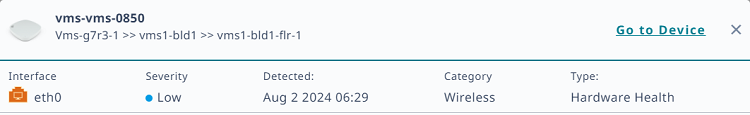
To open the Hardware Anomaly panel, select a device, for which anomalies have been detected, from the table. The panel includes the following information:
This section provides general information about the anomaly. To get more information about the device, select Go to Device.
<name of device> memory utilization is consistently above 90%.
Identify the process or service causing high memory usage using the CLI command 'show memory detail'.
| Chart | Display on hover | Expand on select |
|---|---|---|
| Total Throughput | Total throughput | Detailed chart showing: total, unicast tx, rx, broadcast tx, rx and multicast tx, rx traffic |
| Total Client Count | Total number of clients | Client details: MAC, client hostname, client OS |
| Reboot | Reboot code and reason | None |
| PoE Mode | AP PoE power mode | None |
| Device Temperature | AP temperature | None |
| CPU Utilization | Percentage of CPU utilization | CLI output for show system process state |
| Memory Utilization | Percentage of memory utilization | CLI output for show memory detail |