Governance Dashboards
Governance dashboards provide information such as access congestion, application distribution, capacity planning and enable you to study the interaction between the SD-WAN Orchestrator and your network. These dashboards are designed for long-term decision-making by management.
Also refer to "Navigating a Dashboard - Use Case"and "The Reporting Toolbar".
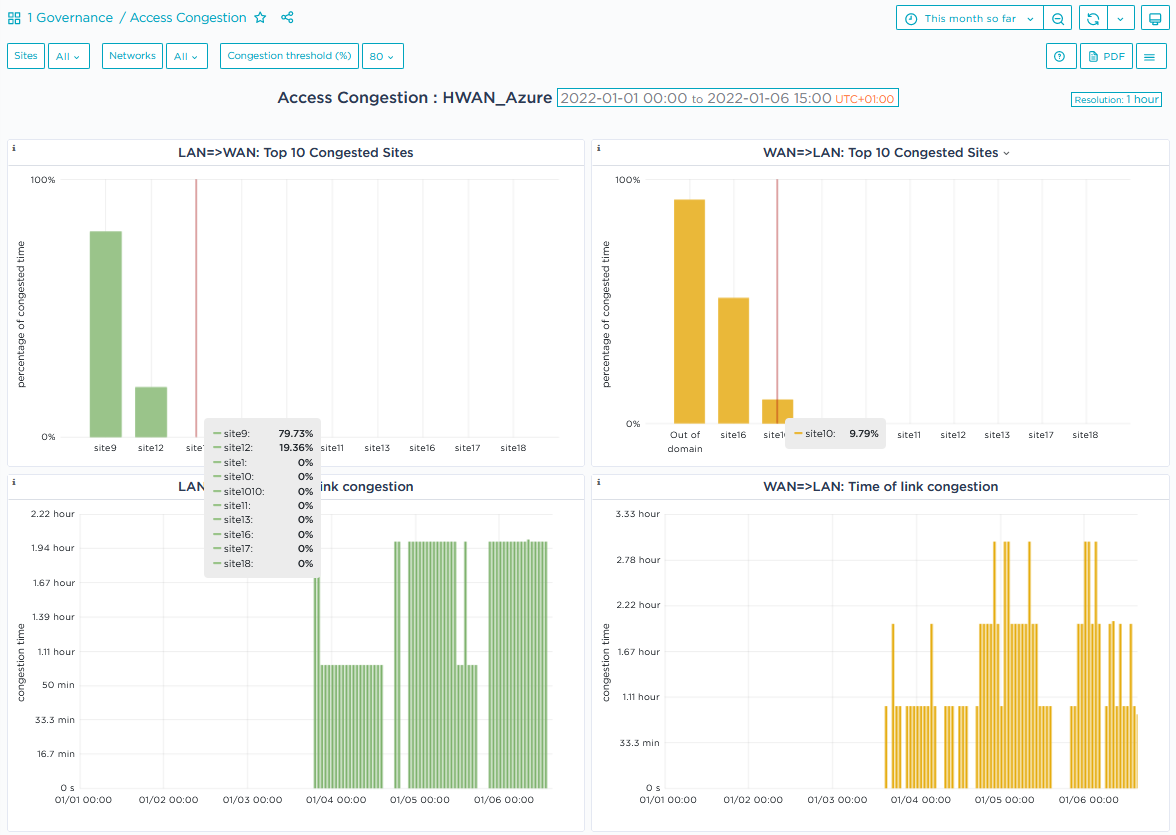
This dashboard enables you to anticipate network access required sizing by showing the congestion trend of network access during the last month (default time range of this dashboard).
This dashboard displays the percentage of congestion time for the top 10 congested sites in both the LAN=>WAN and WAN=>LAN directions. The second pane of the dashboard shows the total congestion time in milliseconds for each link in both directions, from the LAN to the WAN and from the WAN to the LAN.
You can filter dashboard display by site, network and congestion threshold in percentage: 80, 90 and 95 are the values by default. You can also type any other percentage.
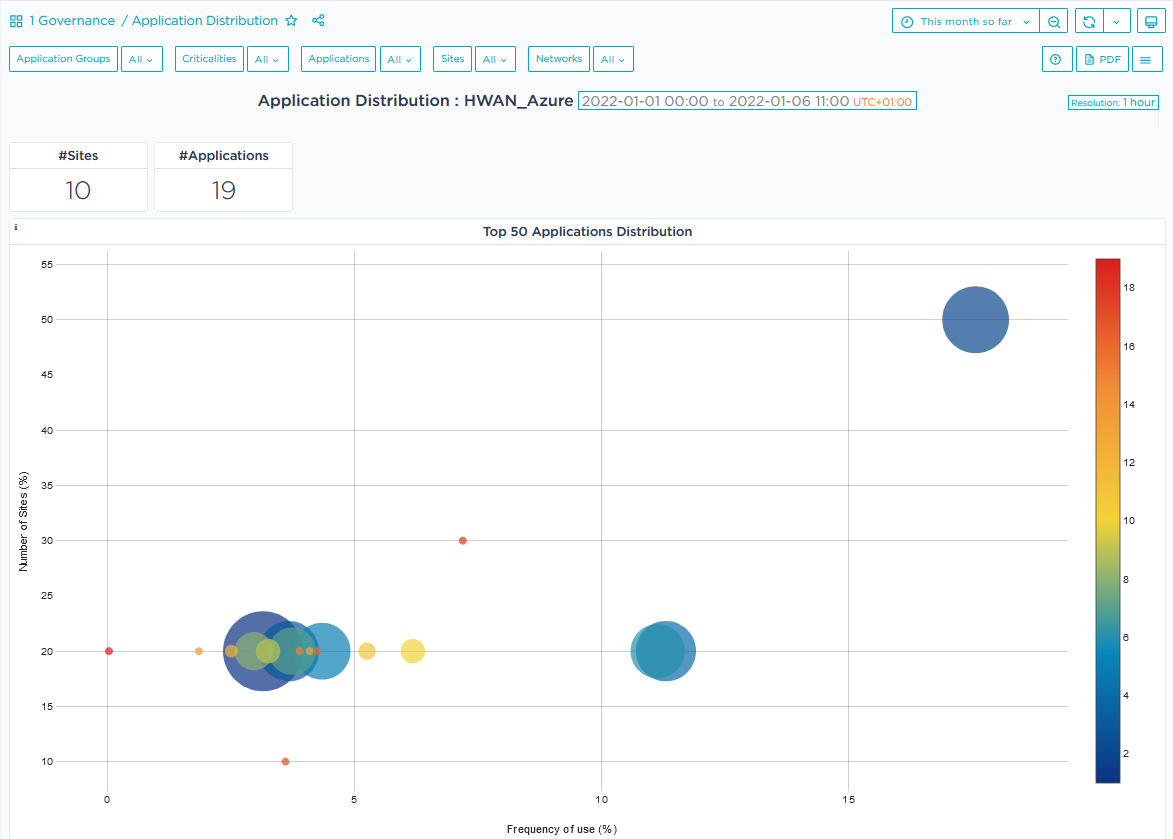
The scatter plot diagram of this dashboard showing Top 50 Application Distribution enables you to check how often and on how many sites an application is seen by the system during the last month (default time range of this dashboard).
The Y axis represents the number of sites in percentage whereas the X axis corresponds to the frequency of use in percentage.
With respect to the right color bar, the size and color of each application circle varies according to volume and volume rank.
When you position your cursor over an application circle, the displayed popup window indicates the previous information, i.e.:
| • | application name |
| • | usage frequency as the first value and the number of sites (in percentage) as the second value |
| • | volume |
| • | rank |
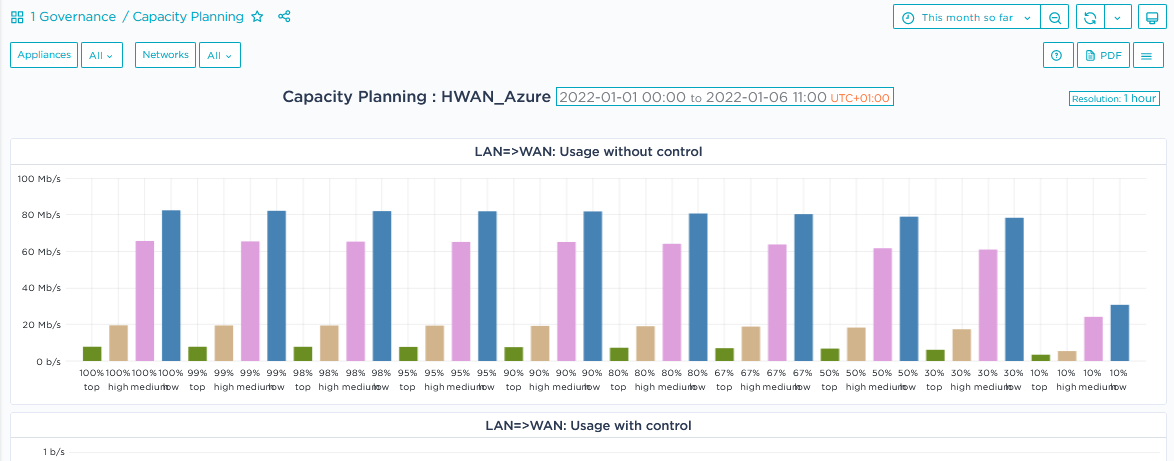
This dashboard enables you to determine network access size based on the amount of protection you want for your applications. The default time range of this dashboard is the last month.
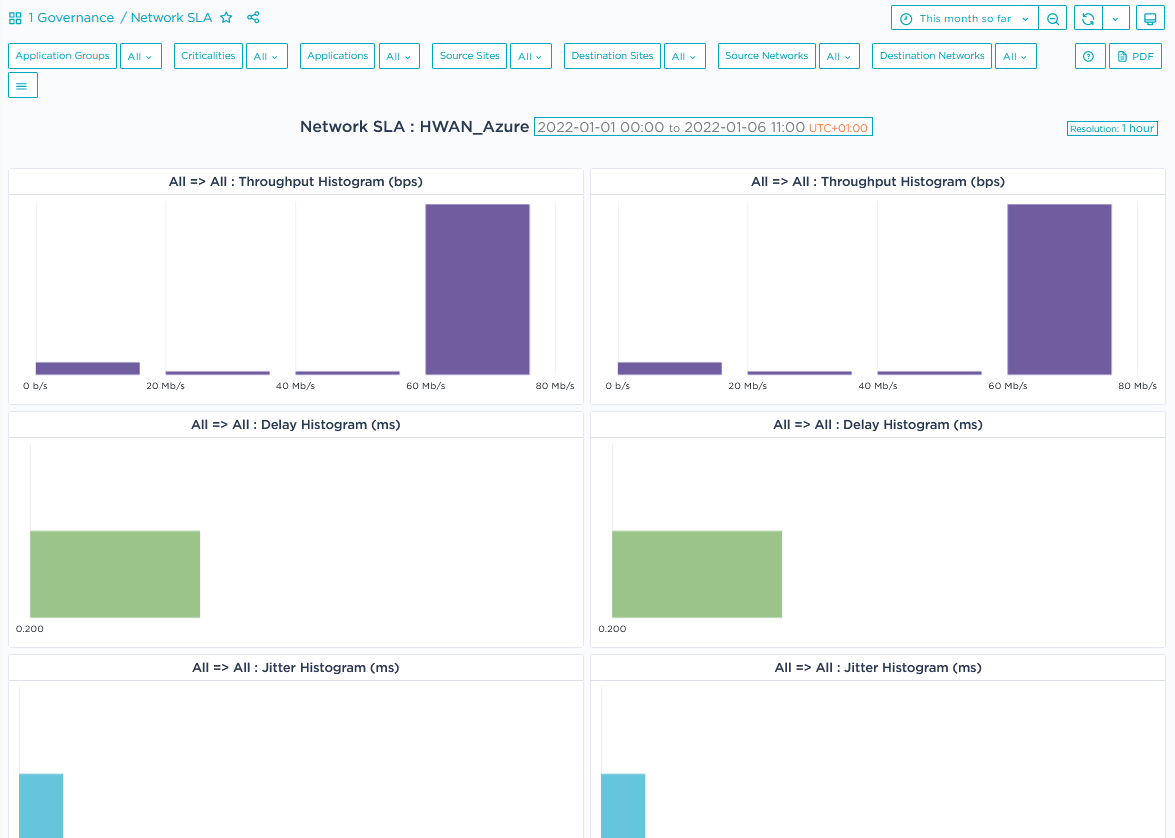
This dashboard enables you to follow up Service Level Agreement typical performance metrics of the network service provided by network providers. Histograms of throughput, delay, jitter, packet loss and link availability are displayed. The default time range of this dashboard is the last month.