Navigating a Dashboard - Use Case
The General Reporting/Overview dashboard is displayed by default when you access the Reporting function. This dashboard is an overview of EQS (see "Application Flows - Detailed flows list"), Volume and Throughput per Application, Application Group, Site and Network.
The following functions affect all the dashboard cells.
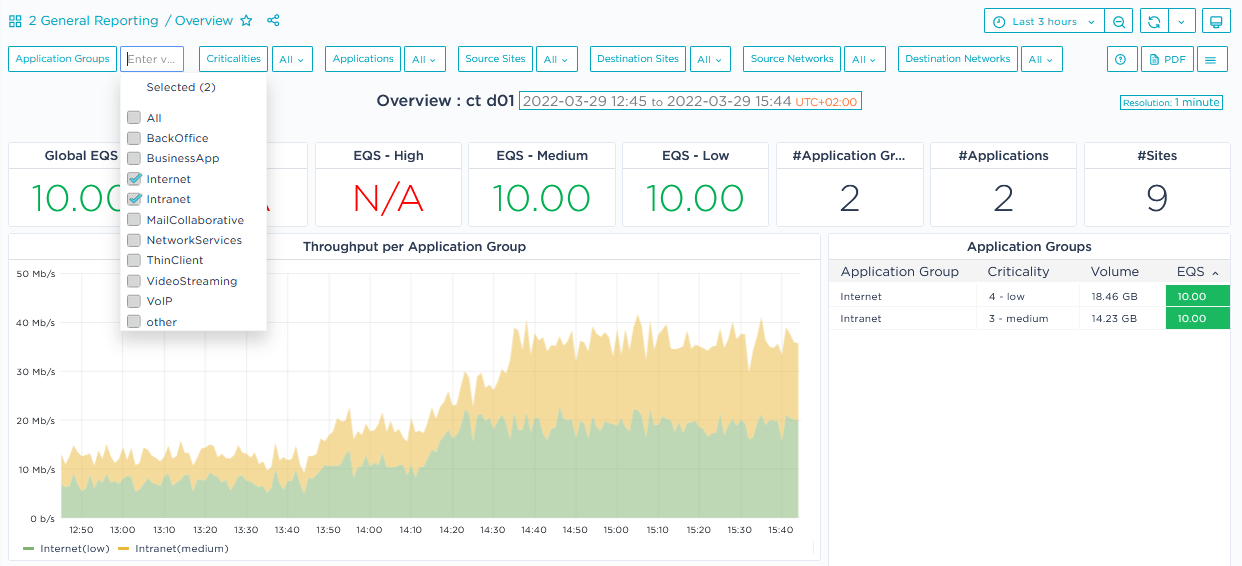
Filtering objects
All your objects are displayed by default. You may select some specific objects to analyze in each filtering stack.
Selecting the Display Criteria
| 1 | From the button toolbar located in the top right corner of the dashboard, click the Time Range button. It specifies the current time range. |
Depending on the dashboard category, default time range values are the following:
| • | 1 Governance: last month |
| • | 2 General Reporting: last 24 hours |
| • | 3 Usage and Performance: last hour |
| • | 4 Supervision: last 24 hours |
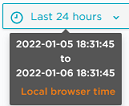
You can modify the default time range by applying an Absolute Time Range you have defined, or by selecting a Relative Time Range from the list.
| 2 | The report default time zone (local browser time) is displayed in orange in the report sub-title. You can modify this value by selecting Change time settings in the Time Range selector. |

| 3 | Data resolution is specified in blue at the right of the report sub-title. It indicates the statistics period or granularity of the displayed information. |
| 4 | If you want your dashboard to be refreshed automatically, select a period from the Refreshing stack:  |
Instead of defining an automatic refresh period, you can refresh the dashboard manually by clicking the  button.
Zooming Out
Click the  button in the top right button toolbar to zoom out dashboard display. The time range is extended as specified at the top of the window:
  .
.
You can use the arrows on both sides of the time range to move forward and backward (one time range shifts).
Zooming In
Zoom in on any time series graph by positioning your cursor on a specific section of the graph and dragging to the right. The result graph displays more points at a lower display rate. You can continue zooming in until you reach the necessary detailed report.
Displaying Tooltips
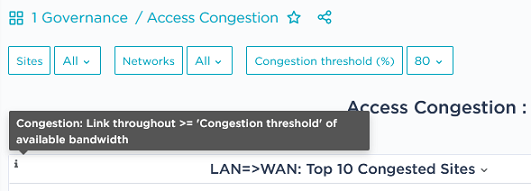
Click the ![]() icon in the cell top left corner of some dashboards to display short information about cell display. These tooltips may help you read some special graphs.
icon in the cell top left corner of some dashboards to display short information about cell display. These tooltips may help you read some special graphs.
Using Dashboard Cell functions
Click the title of any cell in the dashboard to display the functional menu. The available functions depend on the type of presentation (pie chart, bar chart, time series graph, table, etc.).
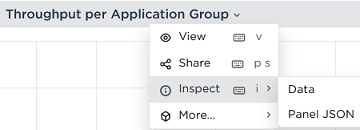
| • | Use the View function to fully display this dashboard cell on the Reporting window. |
| • | Use the Share function to link, embed or take a snapshot of this dashboard cell. Refer to "Sharing the dashboard". |
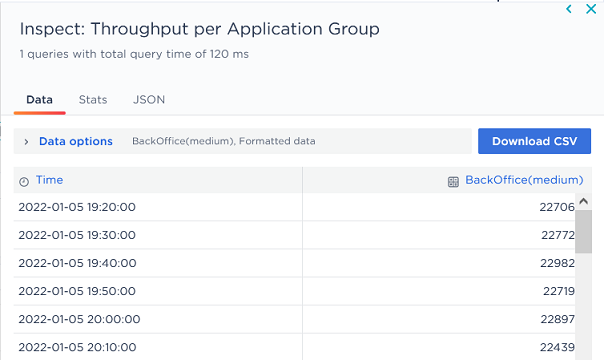
| • | Use the Inspect -> Data function to export the cell data as a .csv file, display statistics and JSON panels, etc. |
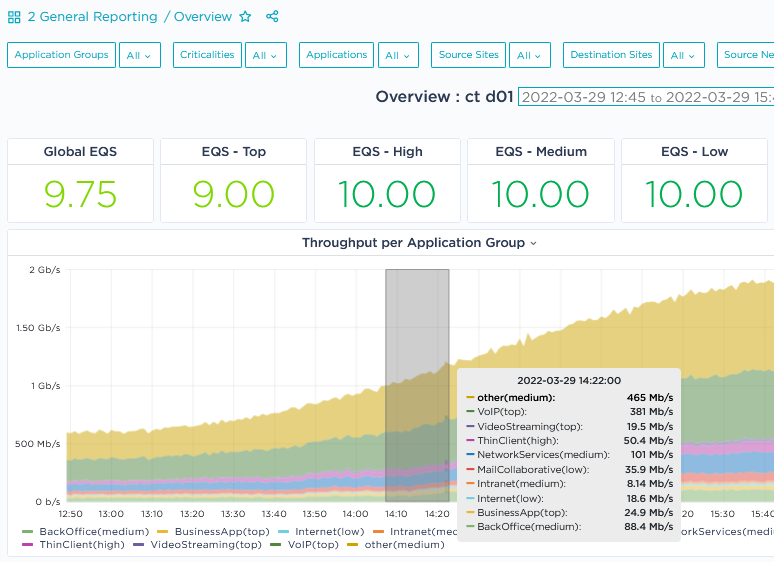
| • | Use the More -> Toggle legend function to hide/display the legend when the cell contains a graph. |
You can also click legend elements for exclusive display. If you want to display a few curves only, keep the CTRL key pressed down and click the appropriate legend elements.
Sorting Table columns
On a table, you may sort column data by clicking the column header names.
Accessing other dashboards
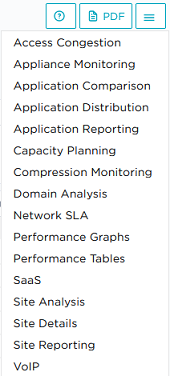
Through the ![]() button located beside the object filters at the top of the window, you can select all the other predefined dashboards. They are displayed in new windows, with the same time range and the same filters as the initial dashboard.
button located beside the object filters at the top of the window, you can select all the other predefined dashboards. They are displayed in new windows, with the same time range and the same filters as the initial dashboard.
You may define the most frequently used dashboards as favorites through the ![]() button located at the right of the dashboard title. You can filter these 'starred' dashboards in the list of predefined dashboard categories.
button located at the right of the dashboard title. You can filter these 'starred' dashboards in the list of predefined dashboard categories.
Exporting the dashboard as a PDF file
Through the ![]() button located beside the object filters at the top of the window, you can export the current dashboard as a PDF file.
button located beside the object filters at the top of the window, you can export the current dashboard as a PDF file.
Through the ![]() button at the right of the dashboard title, you may share a dashboard by creating a link to it, creating a snapshot of this dashboard or exporting it.
button at the right of the dashboard title, you may share a dashboard by creating a link to it, creating a snapshot of this dashboard or exporting it.
| • | From the Link tab, you can create a link to the current dashboard via an URL. |
| • | Hit the Snapshot tab and define your parameters. After clicking the Local Snapshot button, copy the generated URL. |
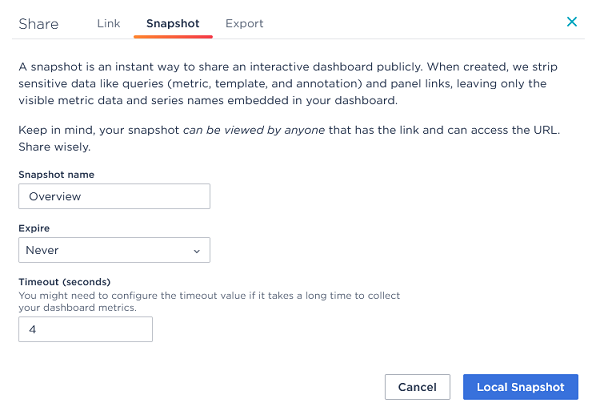
Then, the snapshot URL appears in the Management list.
| • | From the Export tab, you can export the dashboard through a JSON file to be shared externally. |
Accessing Help
Through the Help button  located beside the object filters at the top of the window, you can access help for each dashboard.