Supervision Dashboards
Supervision dashboards enable you to monitor the appliance infrastructure. The default time range of these dashboards corresponds to the last 24 hours.
Also refer to "Navigating a Dashboard - Use Case"and "The Reporting Toolbar".
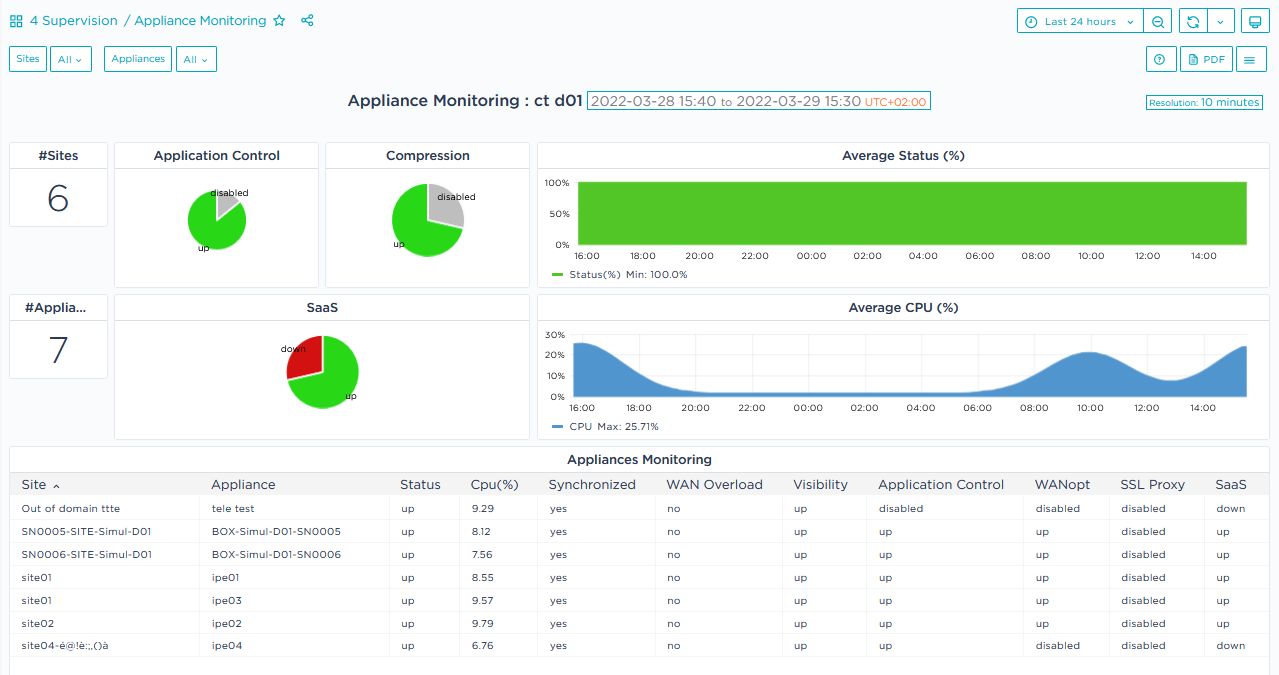
This dashboard informs you of the health and status of deployed Appliances. You may filter the data of this dashboard by Site and by Appliance.
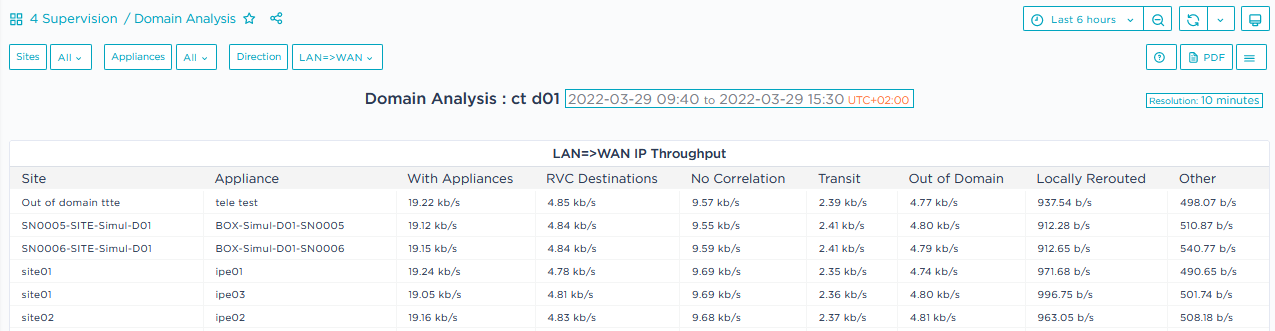
This dashboard displays detailed throughput data in the LAN=>WAN and WAN=>LAN directions for the Sites of the Domain. You can filter the information by Site, Appliance and Direction.
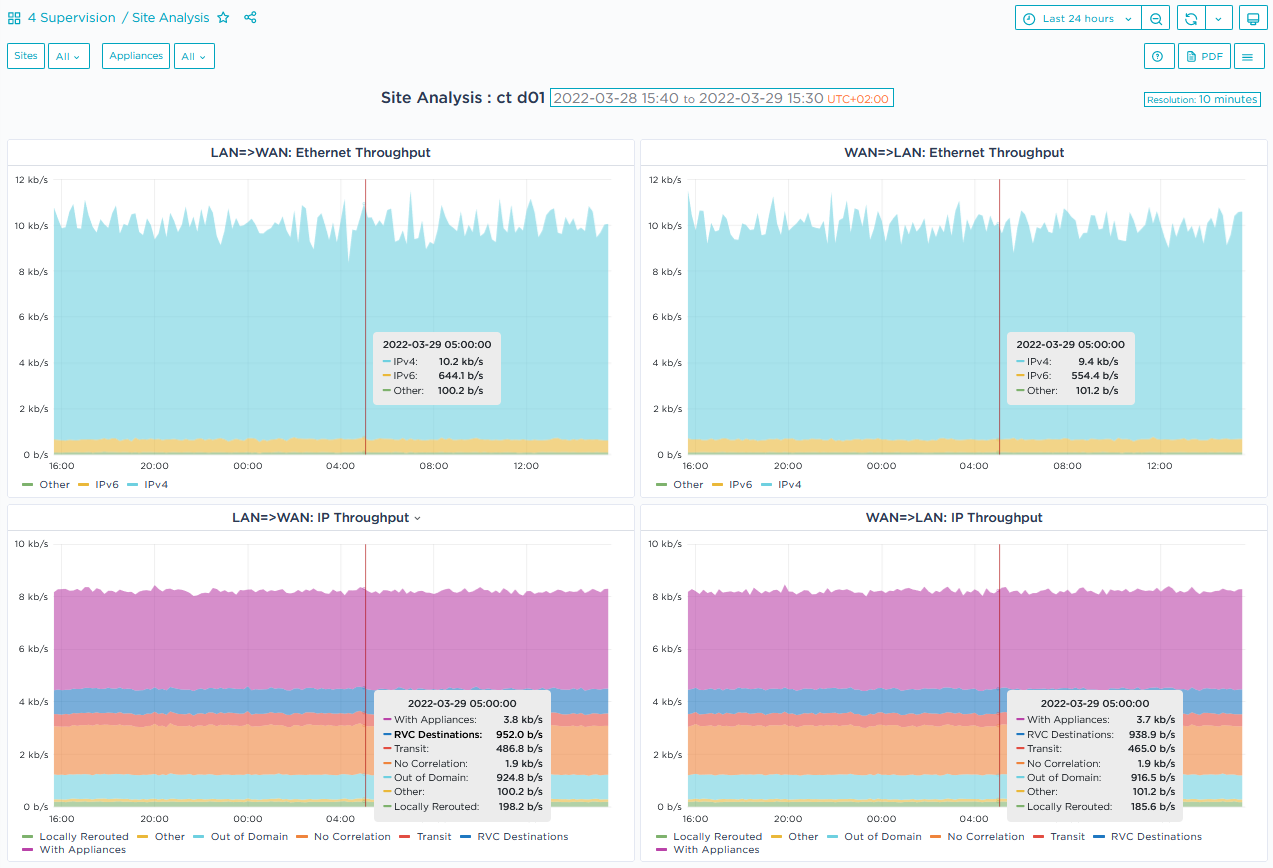
This dashboard affords a clear insight into traffic recognition by Appliances.
You may filter the data of this dashboard by Site and by Appliance.
The top pane displays Ethernet throughput per type of traffic (IPv4, IPv6 or Other) in both the LAN=>WAN and WAN=>LAN directions for the selected appliance(s).
The bottom pane of the dashboard displays IP throughput by specifying how traffic is identified by the selected appliance(s) (..., virtual, out of domain, transit,...) in both the LAN=>WAN and WAN=>LAN directions.