Surveying SD-WAN appliance details
You can access this information window by clicking the ![]() icon for any appliance on the Network -> Configuration window.
icon for any appliance on the Network -> Configuration window.

This window is divided into four sections/tabs that enable your network administrator to check detailed configuration information for a specific appliance before troubleshooting. The process of data collection only starts when you open the window.
The main parameters of this appliance are specified at the top, beside the Extreme Networks logo.
Except for the Overview section where data are refreshed every second, the Last updated incrementing counter in the other sections of the window lets you know when data display was last refreshed. Note that when the connection with the appliance is lost, this counter is blinking: 
Overview
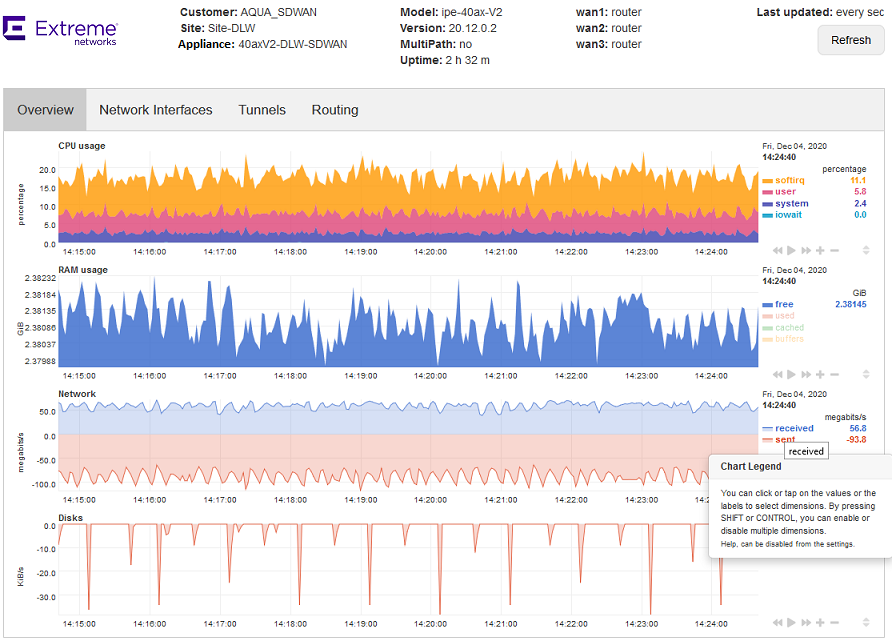
This section displays:
| • | the current CPU usage in percentage and an evolution graph of CPU usage over the last 15 minutes |
| • | the current RAM usage in percentage and an evolution graph of RAM usage over the last 15 minutes |
| • | the current traffic received from and sent to the network in bits/s and an evolution graph of received/sent traffic over the last 15 minutes |
| • | the current reads and writes (I/O) on disks in bytes/s and an evolution graph of them over the last 15 minutes |
The previous metrics are refreshed every 1 to 5 seconds whereas the time span of the graphs corresponds to the last 15 minutes with 1s to 5s data points. Note that you can also refresh the data manually by clicking  in the top right corner of the window.
Note: the curves that represent sent traffic on the Network graph and out traffic on the Disks graph are not negative but displayed that way for distinctness.
In the legend, click the labels or values to limit graph display to specific curves. Simultaneously press the Shift or Control key and click a label/value to enable or disable curve display.
The following sections (Network Interfaces, Tunnels and Routing) include tables of data and no graphs. You may filter table information by entering a filter in the top row of every column. You may sort table information by clicking the heading name of each column.
Network Interfaces
This section provides the status of the physical and logical network interfaces. Table data are collected every 10s.
Note that the Router column of both tables specifies either the appliance itself (Local) or one appliance embedded router (Router 1/2/3) related to a WAN interface.
This section contains two sub-tabs, GRE and IPsec.
| • | The GRE Tunnels table lists the entry points of the GRE tunnels between the appliances of your network. Table data are collected every 10s. |
| • | The IPsec Tunnels and Security Association table provides detailed information about the tunnels created by interface. Table data are collected every 30s. |
In the example below, the first two IPsec tunnels are EdgeSentry tunnels.
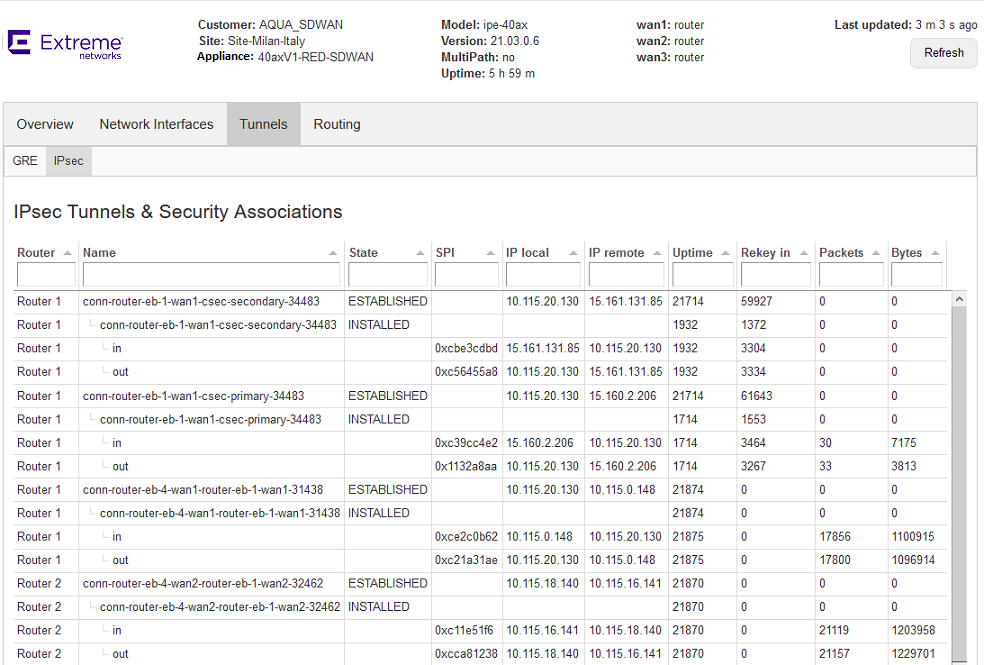
The example below displays a CloudMesh tunnel.

An additional table contains IPsec Log entries. Log data are collected every 5s.
Routing
The Routing section contains five sub-tabs: Routes, OSPF, VRRP, HA, ARP and Logs.
The information of all Routing sub-tab tables is not automatically refreshed when you navigate from one sub-tab to another; this behavior enables you to compare the different data for the same data collect. To refresh the information of all Routing sub-tab tables, do it manually by clicking  in the top right corner of the window.
The data of all these tables are collected every 30s, except Log data which are collected every 5s.
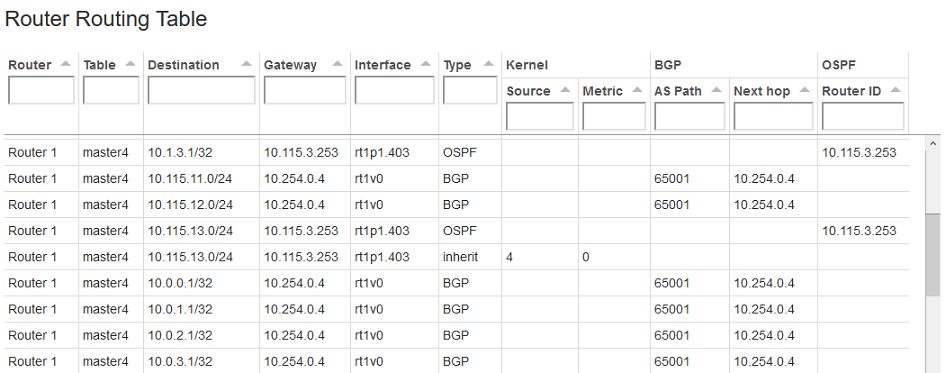
| • | The Local/Router Routing tables lists the IP routes between Sites. |
| • | The VRRP table data let you know whether your VRRP configurations (if any) are working or not. Refer to "Configuring a multi-appliance Branch Office Site through VRRP". |
| • | The OSPF table data let you know whether OSPF configurations (if any) are working properly. |
Select the Router (1/2/3) for which you want to display OSPF Neighbors and OSPF Areas information. By default, all the available routers are selected. Refer to "Configuring a multi-appliance Hybrid Data Center through OSPF".
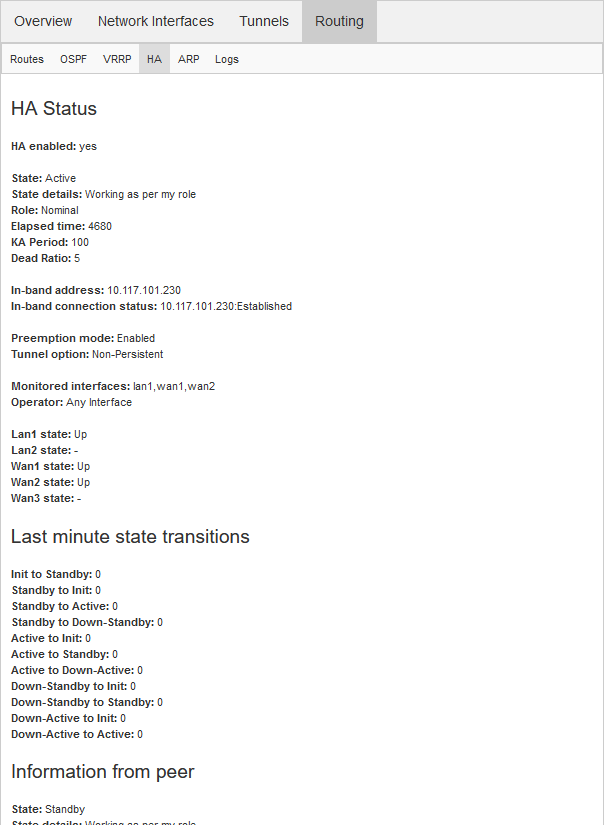
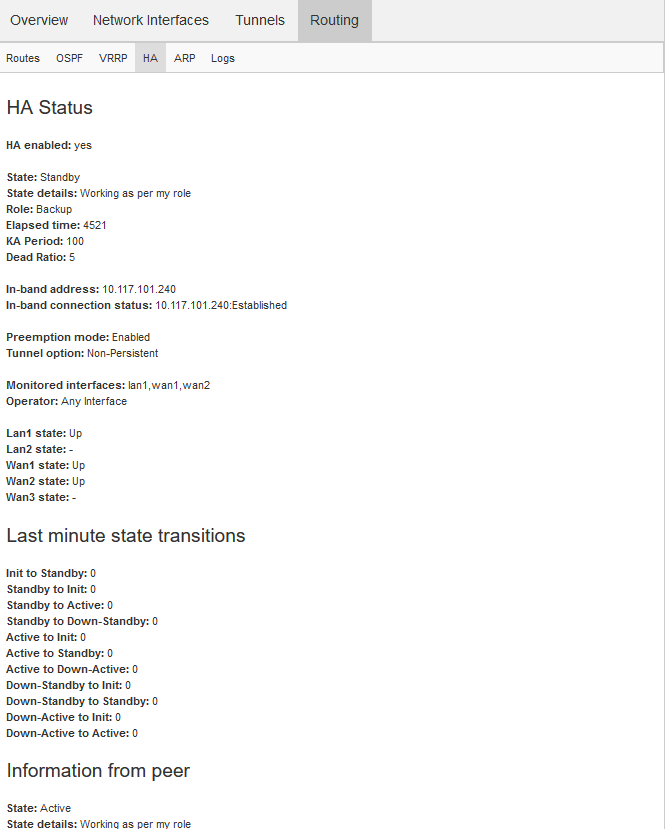
| • | The HA Status data let you know whether IHAP configurations are working properly. This information is provided for each selected HA appliance. Refer to "Configuring a multi-appliance Branch Office Site through IHAP". |
|
|
| • | The ARP Cache displays all necessary data. |
| • | The Logs table displays BIRD logs. |