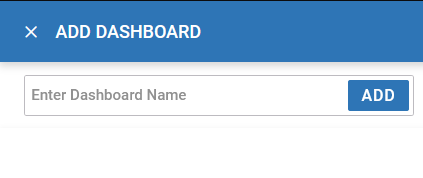
Add a Custom Dashboard
You can add a custom dashboard or create a new dashboard using the dashboard widgets to monitor your network performance and organize your network data.
-
From the default dashboard,
select the plus sign.
The system displays the Add dashboard tab.
 Add dashboard
-
Type a dashboard name in the
Name
field.
If you do not assign a unique name to a dashboard, it is automatically saved as Dashboard with a number. Example: Dashboard 2.
-
Select
<system>or a site from the list of available sites.
Note
The widgets options change according to the system or site selected. -
Drag a widget at a time onto the dashboard area.
Use widgets to create custom dashboard graphs. The widget graphs display various information about the device that will help you view multiple device information for comparison on a single screen. The following widgets are available for selection for system-wide and individual site graphs:
System widgets Individual site widgets Device Status Clients by Band Device Type Clients by Channel Device Type Distribution Device Status Device Status Distribution Device Type System Security (threat level) Device Type Distribution RF Quality (worst 5) Device Status Distribution Radios (top radio count) Radios by Band Clients (top client count) Radios by Channel Client Quality (RF-Domain specific) Top 5 Radios by Clients Radio Quality (RF-Domain specific) Wireless Client Traffic Utilization (RF-Domain specific) NTP Traffic and Association (RF-Domain specific) - To remove a graph from
the dashboard area, select
 .
. - To open or save a graph
as an image, select
 , and select OK.
- To remove a graph from
the dashboard area, select
-
Select Save.
The custom dashboard is saved.
