Print
this page
Print
this page Email this topic
 Feedback
 View PDF
 Download EPUB
Using Hyperglance Graphics Compatibility Mode
You can re-adjust the discovered network image by right-clicking anywhere in upper, left panel and dragging the pointer to the desired position.
Use the middle button on your mouse to zoom in or out on an image.
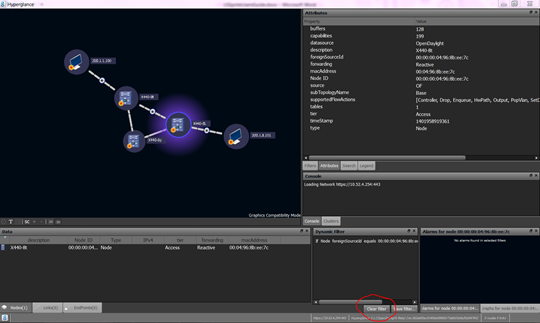
You can select a switch in network image to show details under the Data and Attributes panels (lower left and upper right, respectively).
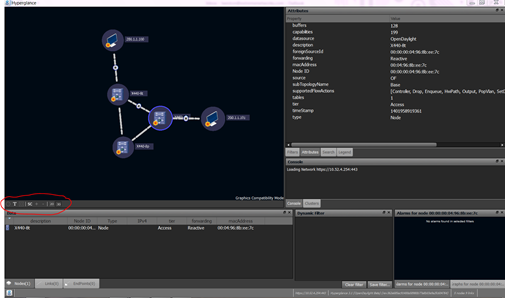
The area circled in red in Hyperglance contains the following icons, in order:
- Center (centers network in view)
- Node labels
- Full screen
- Show connected mode
- Add and subtract connected nodes
- 2-D and 3-D graphics modes
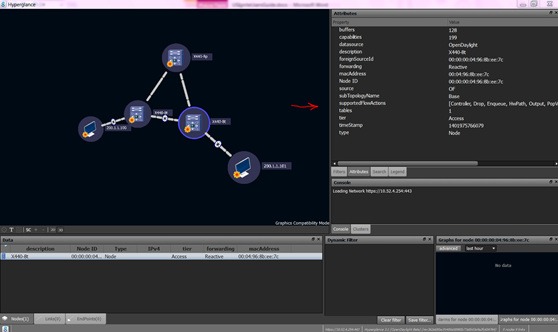
By double-clicking a switch, a 3-D cube envelops the switch, and the network is centered with respect to that switch. To undo, click the center icon again.
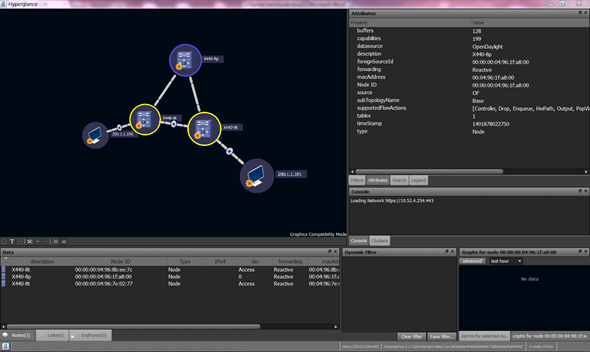
Right-clicking a selected switch, accesses a menu. You can also access this menu by right-clicking the selected switch on the Data Panel (lower left).
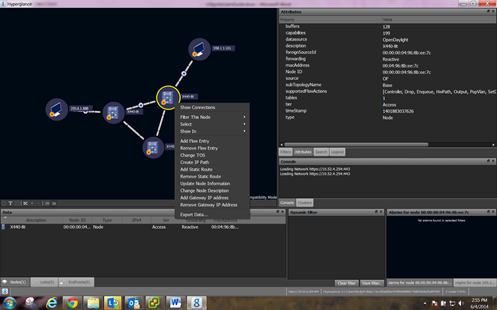
The menu includes every feature allowed in OneController with the addition of filters, select connected end points, and show in graph form. Hyperglance also allows you to export the switches‘ attribute information to a file.
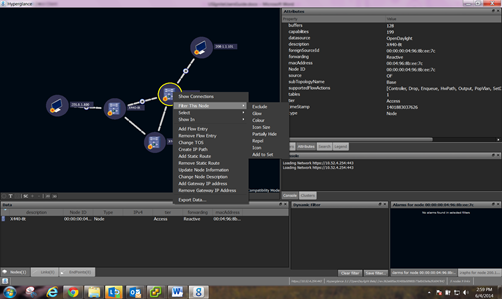
Hyperglance shows the selected glow filter, which is helpful with large networks containing hundreds of switches. You can clear filters by clicking the Clear Filter button on the lower middle panel.
You can also add or remove flows using the menu.
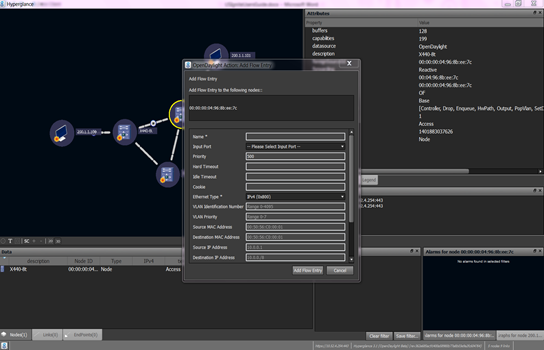
Flows (proactive default flows, reactive, and learned) appear in the Attributes Panel (upper right). Additional flows pushed from Affinity also appear.
You can select all switches by pressing CTRL + click. Switches then populate the Data Panel.
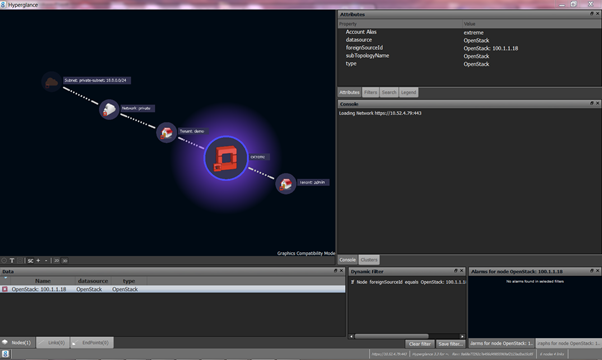
The following image shows an example of an OpenStack discovered network: