Troubleshoot Configuration

Use the Monitor/Troubleshoot page to select a device configuration and view the statistics in the service chain.

About this task

For any selected device, you can view the members of the related ingress and egress groups. You can also view the configuration of the related ingress policy, such as the protocol, the source IP address, and the Ethernet type.

Real-time statistics, such as packet flow and bit rate, can help you troubleshoot device issues. These statistics are available when you drill down to the Troubleshoot Configuration by Ingress Group page.

Procedure

  1. In the Navigation menu, select Device Inventory.
  2. In the Devices page, click anywhere in the required device row except the Actions column (Actions column icon) to proceed to the device Overview page.
  3. Select the Monitor/Troubleshoot tab.

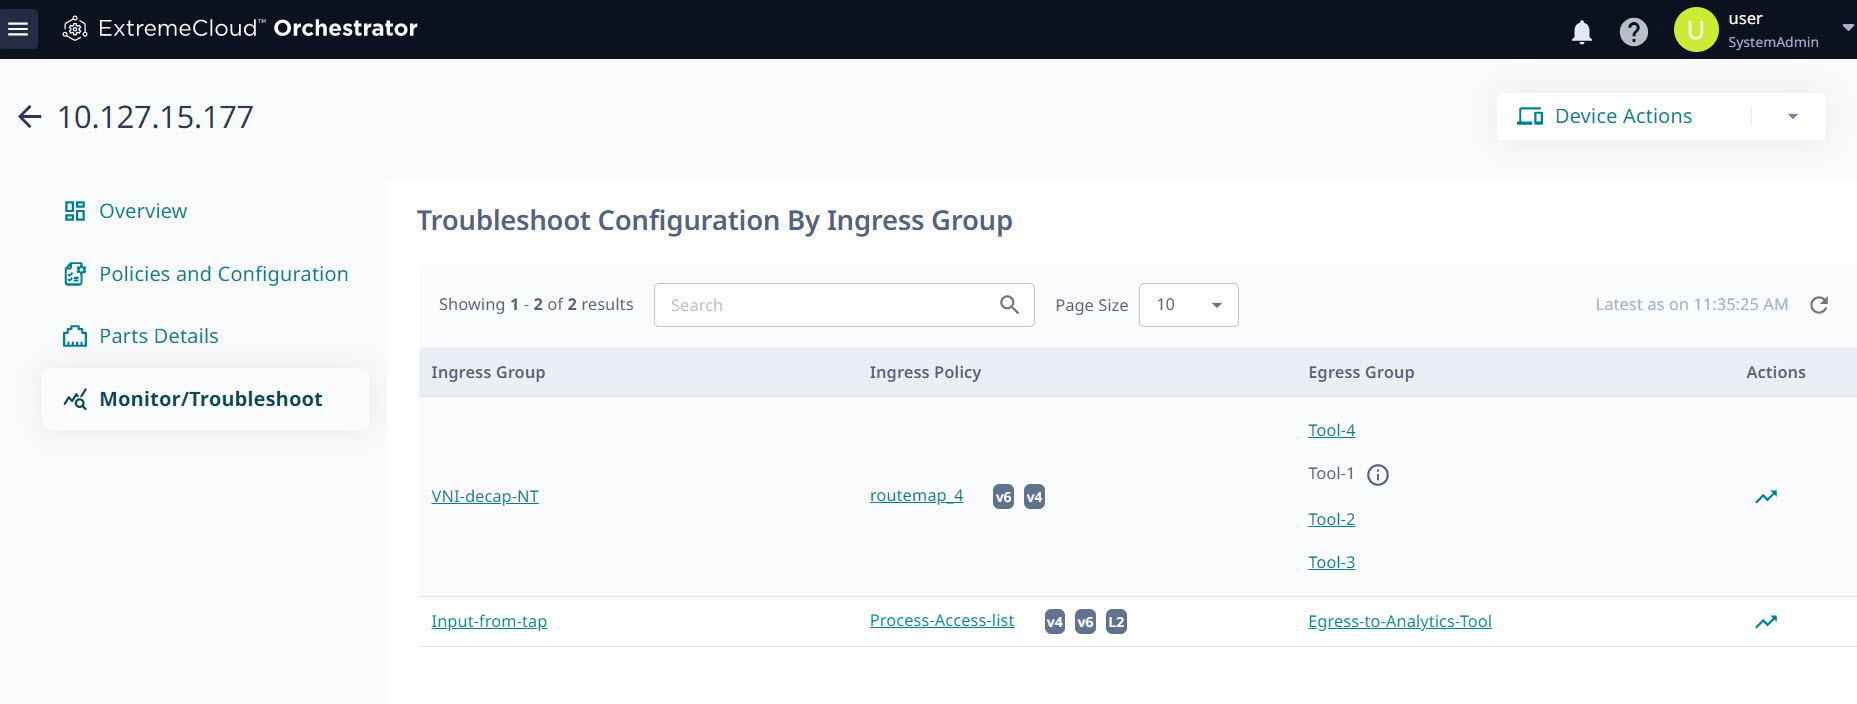
    The Troubleshoot Configuration by Ingress Group page displays a list of ingress groups and their related ingress policies and egress groups.

    Monitor/Troubleshoot page displays the list of ingress groups, ingress policies, and egress groups in the service chain

    The list of ingress policies shows the related protocol and layer.

  4. To view details of an ingress group, such as its members, select the name of the group.

    The Details pane is displayed at the bottom of the page.

    list of ingress group details

    You can refresh the pane, filter for specific content, and add or remove columns. Use the filtering functions at the upper right of the pane. refresh, filter, and change columns

  5. To view details of a policy, such as its sequence number, select the name of the policy.

    Use the filtering functions at the upper right of the Details pane to change the contents of the pane.

    ingress policy details
  6. To view the details of a egress group, such as its egresses, select the name of the group.

    Use the filtering functions at the upper right of the Details pane to change the contents of the pane.

    list of egress group egresses and members
  7. To view the configuration of an ingress group, select the Troubleshoot ( Troubleshoot icon ) icon for the group from the Actions column (Actions column icon).
    The Troubleshoot Configuration by Ingress Group page opens.

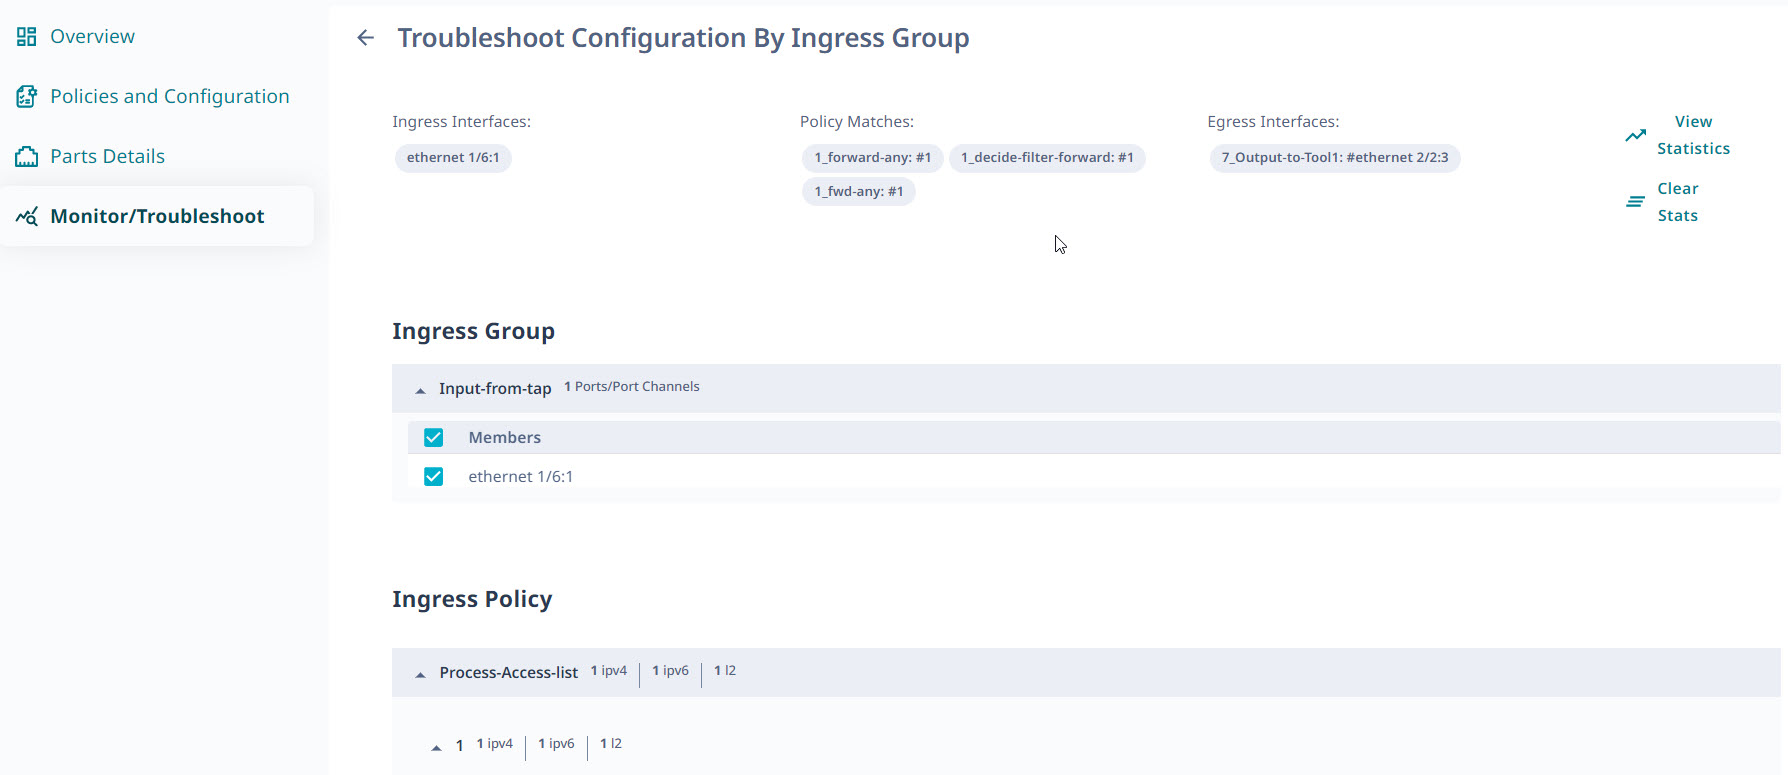
    Expandable lists of policies in the service chain

    The page displays expandable lists of ingress groups, ingress policies, and egress groups.

    1. To display configuration details, select one or more items in the expandable lists
      The details are displayed at the top of the page. In the image, you can see selected interfaces and a matching policy.
    2. To view real-time statistics, select one or more configuration items and then select View Statistics.

      A new page opens to display 3 panels of statistics, the contents of which vary depending on the configuration items you chose.

      three sets of statistics

      You can select Reset Counters to refresh the statistics.

      You can add or remove columns and you can switch to a chart format. Use the functions at the upper right of each panel. add/remove columns and change to graph

    3. To clear statistics selections, select Clear Stats.