Example of Device Statistics Display for APs shows an example of a device statistics display for APs.
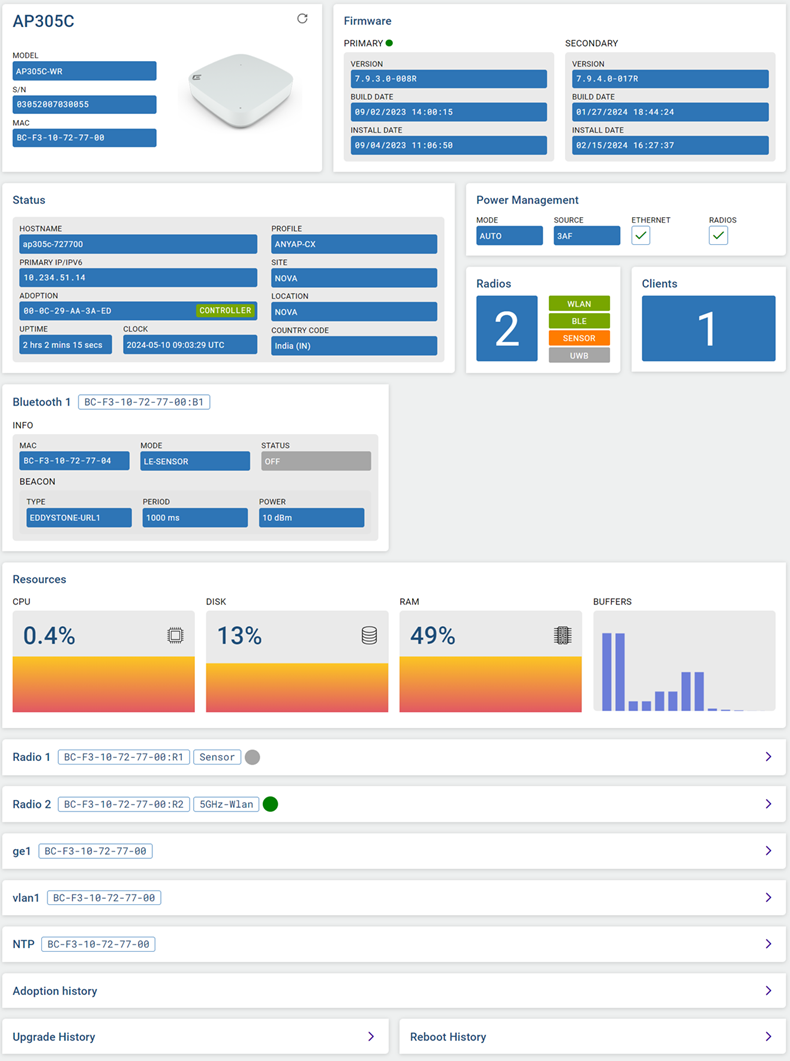
Access Point (AP) statistics are arranged under the following panes (left-to-right, top-to-bottom):
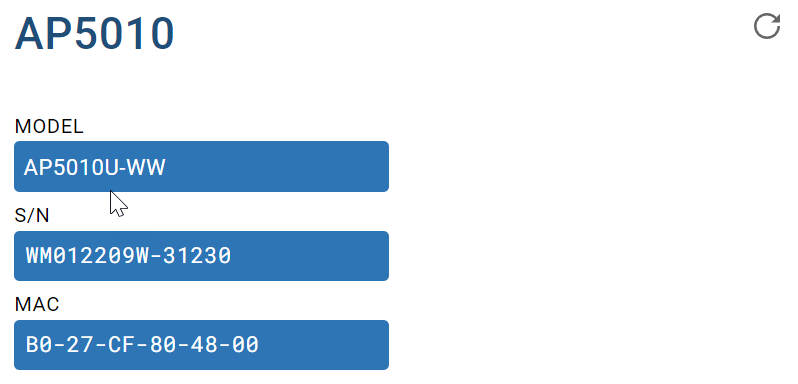
AP Statistics – Example Device Information Display shows an example of device information displayed for APs in the RF Domain.
Select  to refresh the display.
AP Statistics – Device Information Description describes the information displayed.
| Field | Description |
|---|---|
| Type | The AP type is displayed in the upper–left position of the pane. |
| Model | Displays the model of the selected AP to distinguish its exact SKU and country of operation. |
| S/N | Displays the serial number of the AP. |
| MAC | Displays the MAC address of the AP. This is factory assigned and cannot be changed. |
AP Statistics – Example Firmware Information Display shows an example of device firmware information displayed for APs in the RF Domain.
You can store both a Primary and Secondary firmware version in memory. An automatic fallback
mechanism exists, which loads the Secondary version if the Primary version fails. A
 appears adjacent to either Primary or Secondary, indicating which firmware is
currently in use.
appears adjacent to either Primary or Secondary, indicating which firmware is
currently in use.
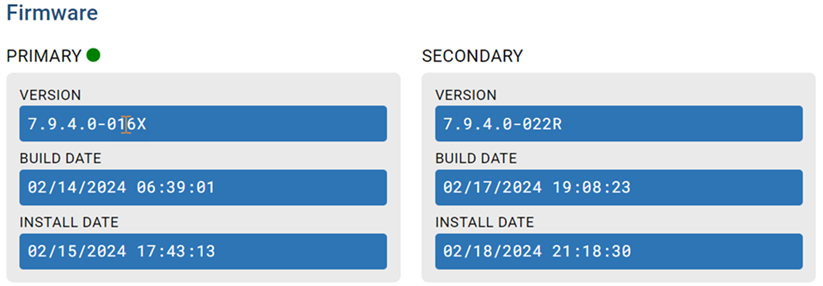
AP Statistics – Firmware Information Description describes the information displayed.
| Field | Description |
|---|---|
| Version | Displays the software (firmware) version on the AP. Use this information to assess whether a firmware upgrade would enhance the AP's support capability. |
| Build Date | Displays the date on which the firmware version build was created. |
| Install Date | Displays the date on which the firmware was installed on the AP. |
AP Statistics – Example Device Status Display shows an example of device status information displayed for APs in the RF Domain.
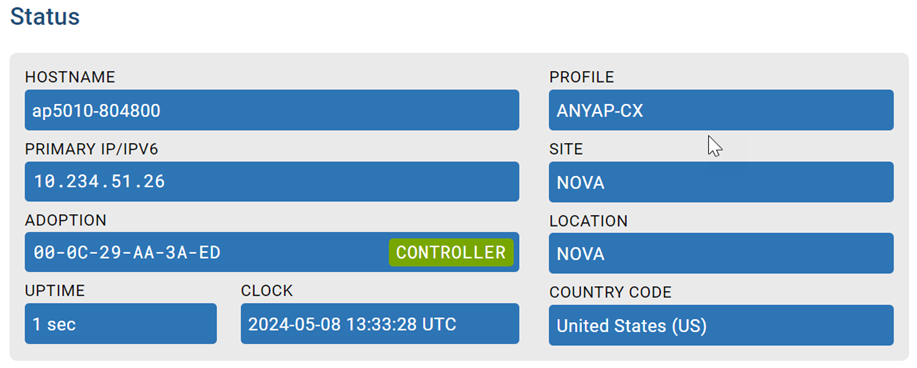
AP statistics – Device Status Information Description describes the information displayed.
| Field | Description |
|---|---|
| Hostname | Displays the unique administrator-assigned name of the AP. |
| Profile | Identifies the Profile that has been assigned to the AP. |
| Primary IP/IPv6 | Displays the IPv4 or IPv6 address assigned to the AP either through DHCP or through static IP assignment. |
| Site | Displays the RF Domain name of which the AP is a member. Unlike a controller or service platform, an AP can belong to one RF Domain only, based on its model. |
| Adoption | Identifies the MAC address of the controller to which the AP has been adopted. |
| Location | Displays the geographical location of the Site (RF Domain), if it is configured. If this parameter is not configured, the Site name appears in this field by default. |
| Uptime | Displays the cumulative time since the AP was last rebooted or lost power. |
| Clock | Displays the date, time, and time zone of system clock. |
| Country Code | Displays the country code assigned to the AP. |
AP Statistics – Example Power Management Display shows an example of power management information displayed for APs in the RF Domain.
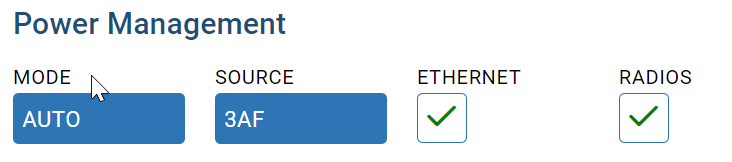
AP statistics – Device Status Information Description describes the statistics displayed.
| Field/Check box | Description |
|---|---|
| Mode |
Displays the configured Power Management mode. Possible modes include:
See Power Configuration (Access Points Only) for a description of these modes and their function. |
| Source | Displays the power mode currently invoked by the selected AP. |
| Ethernet |
Displays the AP's Ethernet port status, as follows:
|
| Radios |
Displays the AP's radio power status, as follows:
Each AP radio is capable of having a unique, administrator-defined power transmission setting. |
AP Statistics – Example Radios and Clients Displays shows an example of radio and client statistics displayed for APs in the RF Domain.
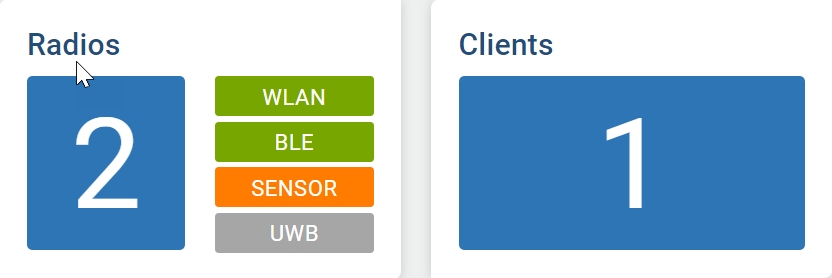
AP Statistics – Radios and Clients Statistics Description describes the information displayed.
| Element | Description |
|---|---|
| Radios | Displays the total number of radios configured on the AP and their assignments: WLAN, BLE, Sensor, or UWB. |
| Clients | Displays the total number of clients connected to the AP. |
AP Statistics – Example Bluetooth Radio Display shows an example of Bluetooth radio information displayed for APs in the RF Domain.
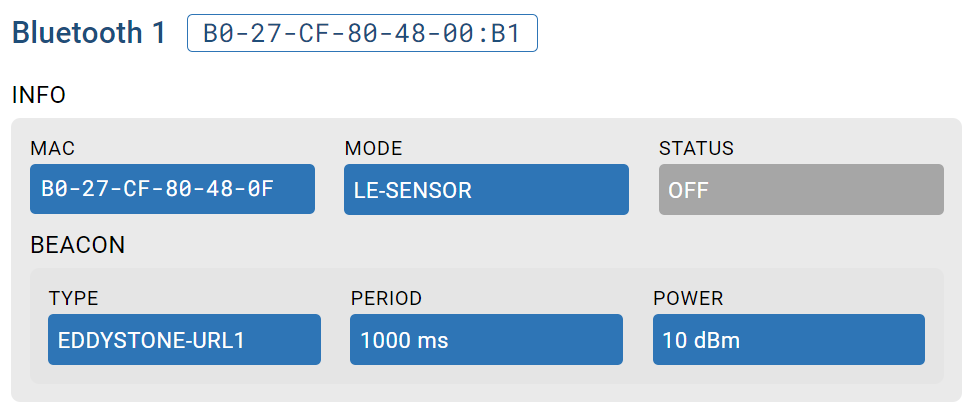
AP Statistics – Bluetooth Radio Information Description describes the information displayed.
| Field | Description |
|---|---|
| Bluetooth 1 | Displays the system-assigned Bluetooth radio name, consisting of the AP's MAC address and the radio number. |
| MAC | Displays the factory-set, hard-coded MAC address for the AP's Bluetooth radio. |
| Mode |
Indicates the current Radio Mode setting for the Bluetooth radio. Possible modes displayed are:
See Manage Bluetooth Configuration for details about these mode types and their function. |
| Status | Displays the current operational status of the Bluetooth radio: either On or Off. |
| Type |
Identifies the transmission pattern currently configured for the Bluetooth radio beacon. Possible pattern types include:
See Manage Bluetooth Configuration for details about these pattern types and their function. |
| Period | Displays the configured Bluetooth radio‘s beacon transmission period (100 – 10,000 milliseconds). |
| Power | Displays the current power level the radio is using for transmissions. |
AP Statistics – Example Resources Display shows an example of Resources information displayed for APs in the RF Domain.
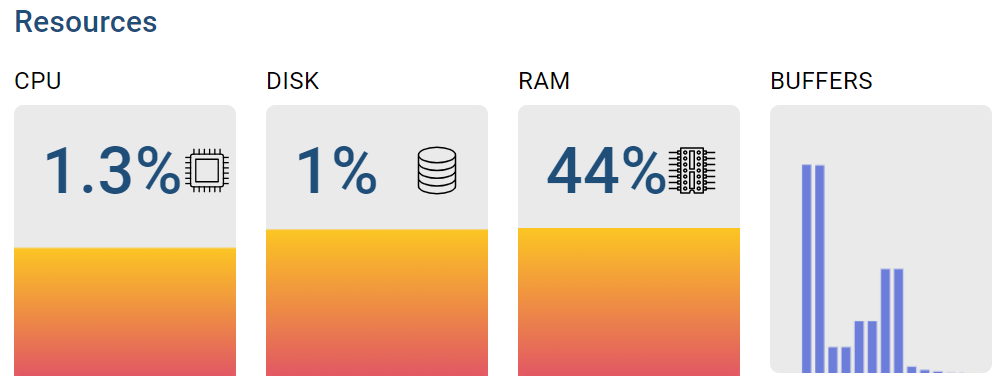
AP Statistics – Resources Information Description describes the information displayed.
| Resource | Description |
|---|---|
| CPU |
Displays the percentage of total available CPU currently in use. |
| Disk |
Displays the percentage of total available disk space currently in use. Hover over the colored area to view a pop-up detailing current disk usage in megabytes (MB). |
| RAM |
Displays the percentage of total available RAM currently in use. Hover over the colored area to view a pop-up detailing current memory usage in megabytes (MB). |
| Buffers |
Displays the current buffers available to the AP. Hover over the bar graph lines to view a pop-up detailing buffer size, current utilization, and buffer limit. |
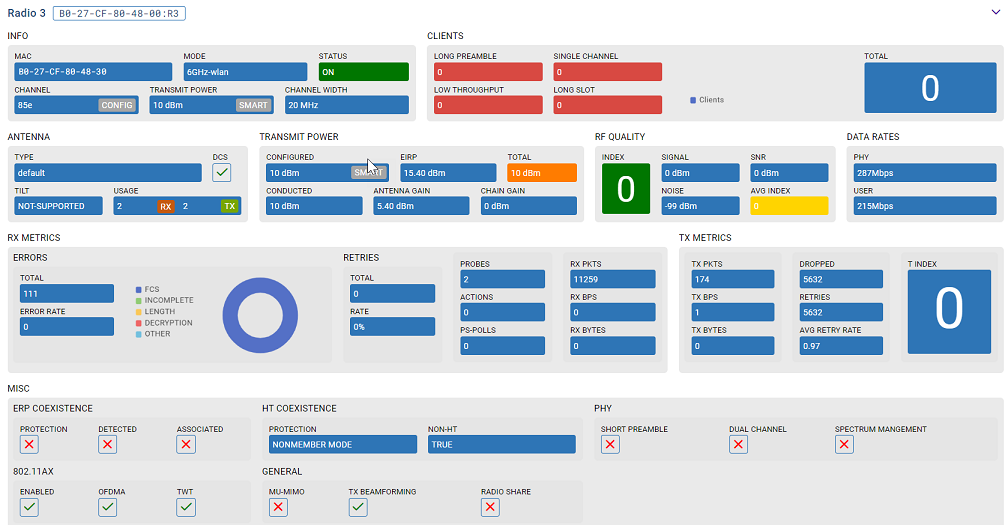
AP Statistics - Radios Information Display and AP Statistics - Radios Detailed Display show an example of Radio information displayed for APs in the RF Domain.
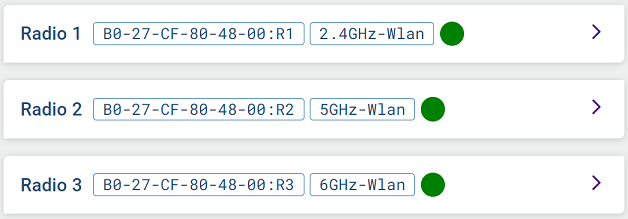
Select  associated with a radio to view further detail.
AP Statistics – Example GbE Port Information Display and AP Statistics – Example GbE Port Details Display show an example of Gigabit Ethernet port information displayed for APs in the RF Domain.
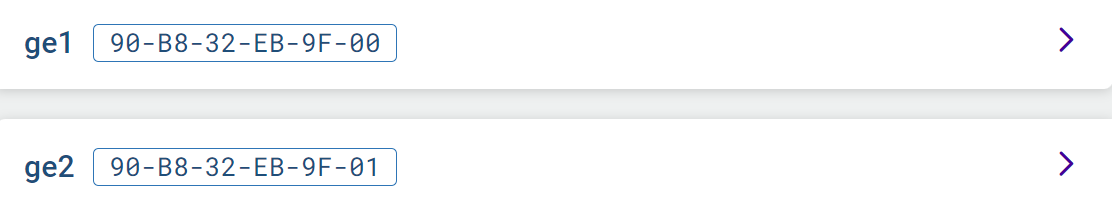
Select associated with a GbE port to view further detail.
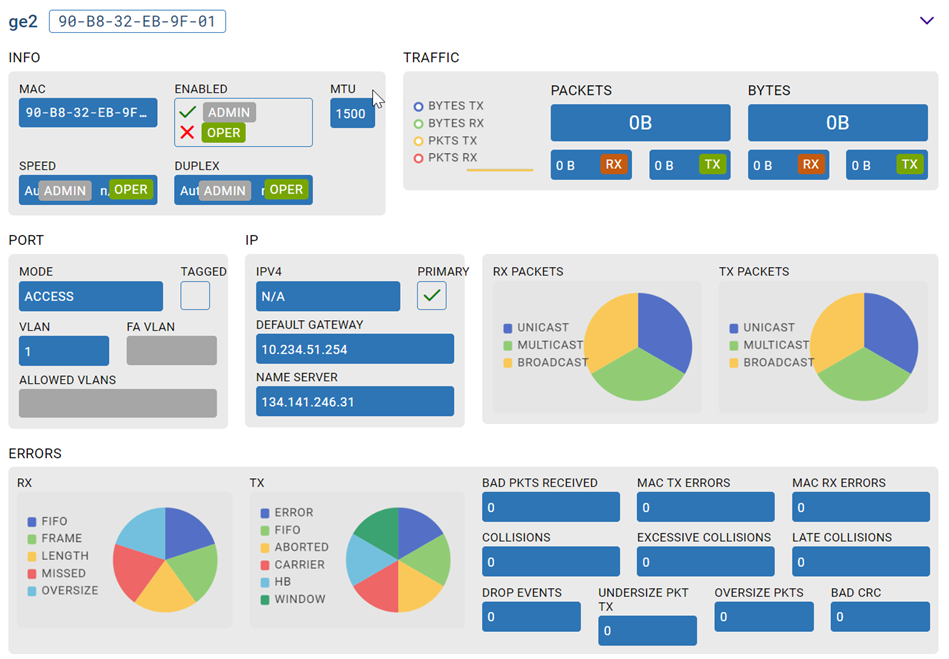
AP Statistics – GbE Port Information Description describes the information displayed in the preceding figures.
| Element | Description |
|---|---|
| GbE Port | Displays the Gigabit Ethernet port name (geX) and interface MAC address. |
| Info | |
| MAC | Displays the interface MAC address. |
| Enabled |
Indicates the interface status, as follows:
|
| MTU | Identifies the largest IPv6-formatted packet size that can be sent over this interface. |
| Speed | Displays the configured interface speed and the actual operating
speed, as follows:
|
| Duplex | Displays the configured duplex setting and the actual duplex
setting in use, as follows:
|
| Traffic | |
| Packets |
RX PKTS: Displays the number of good packets received. TX PKTS: Displays the number of good packets transmitted. |
| Bytes |
RX Bytes: Displays the number of octets (bytes) with no errors received by the interface. TX Bytes: Displays the number of octets (bytes) with no errors sent by the interface. |
| Port | |
| Mode | The Mode can be either of the following:
|
| Tagged |
Indicates whether the VLAN is tagged, as follows:
|
| VLAN | Displays the tag assigned to the native VLAN (if mode is Trunk) or the access VLAN (if mode is Access). |
| FA VLAN | Displays the tag assigned to the Fabric Attach (FA) client VLAN (if mode is Access). |
| Allowed VLANs | Displays the VLANs that exclusively send packets over the port (if mode is Trunk). |
| IP | |
| IPv4 | Displays the IP address of the interface. |
| Primary | The presence of a check mark indicates that the IP address is assigned to this interface either through DHCP or through static IP assignment. |
| Default Gateway | Displays the Default Gateway's IP address. This is the gateway used to route traffic to the specified network. |
| Name Server | Displays the names of the servers designated to provide DNS resources to this access point. |
| RX Packets | Displays the number of multicast/unicast/broadcast packets received through the selected GbE interface in a pie chart. |
| TX Packets | Displays the number of multicast/unicast/broadcast packets sent through the selected GbE interface in a pie chart |
| Errors | |
| RX | Displays RX Errors in a pie chart, as follows:
|
| TX | Displays TX Errors in a pie chart, as follows:
|
| Bad Pkts Received | Displays the number of bad packets received through the interface. |
| MAC TX Errors | Displays the number of transmits that failed because of an internal MAC sublayer error that is not a late collision, excessive collision count, or a carrier sense error. |
| MAC RX Errors | Displays the number of received packets failed because of an internal MAC sublayer that is not a late collision, excessive collision count, or a carrier sense error. |
| Collisions | Displays the number of collisions on the interface. |
| Excessive Collisions | Displays the number of excessive collisions. Excessive collisions occur when the traffic load increases to the point that a single Ethernet network cannot handle it efficiently. |
| Late Collisions | A late collision is any collision that occurs after the first 64 octets of data have been sent by the sending client. Late collisions are not normal, and are usually the result of out-of-specification cabling or a malfunctioning device. |
| Drop Events | Displays the number of dropped packets transmitted or received through the interface. |
| TX Undersize Pkts | Displays the number of undersized packets transmitted through the interface. |
| Oversize Pkts | Displays the number of oversized packets transmitted through the interface. |
| Bad CRC | Displays the CRC error. The Cyclical Redundancy Check (CRC) is the 4-byte field at the end of every frame. The receiving station uses it to interpret whether the frame is valid. If the CRC value computed by the interface does not match the value at the end of the frame, it is considered a bad CRC. |
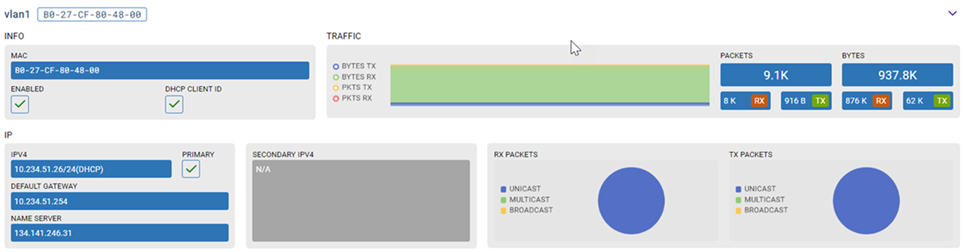
AP Statistics - VLAN Information Display and AP Statistics – VLAN Details Display show an example of VLAN information displayed for APs in the RF Domain.

Select associated with a VLAN to view further detail.
AP Statistics – NTP Status Information Display shows an example of Network Time Protocol (NTP) information displayed for APs in the RF Domain. This information is presented in tabular form.
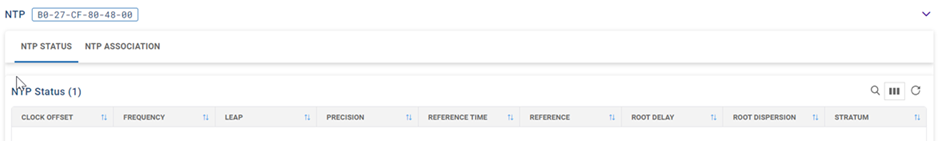
AP Statistics - NTP Information Description describes the type of information displayed under each column in the table.
| Column Heading | Description |
|---|---|
| Clock Offset | Displays the time differential between the AP's time and its NTP resource‘s time. |
| Frequency | Indicates the SNTP server clock‘s skew (difference) for the AP. |
| Leap | Indicates if a second is added or subtracted to SNTP packet transmissions, or if transmissions are synchronized. |
| Precision | Displays the precision of the time clock (in Hz). The values that normally appear in this field range from -6 (for mains-frequency clocks) to -20 (for microsecond clocks). |
| Reference Time | Displays a time stamp indicating when the AP‘s clock was last synchronized or corrected. |
| Reference | Displays the address of the time source with which the AP is synchronized. |
| Root Delay | Displays the total round-trip delay in seconds. This variable can take on both positive and negative values, depending on relative time and frequency offsets. The values that normally appear in this field range from negative values (a few milliseconds) to positive values (several hundred milliseconds). |
| Root Dispersion | Displays the difference between the time on the root NTP server and its reference clock. The reference clock is the clock used by the NTP server to set its own clock. |
| Stratum | Displays how many hops the AP is from its current NTP time resource. |
AP Statistics – Example Adoption History Display shows an example of Adoption History information displayed for APs in the RF Domain.
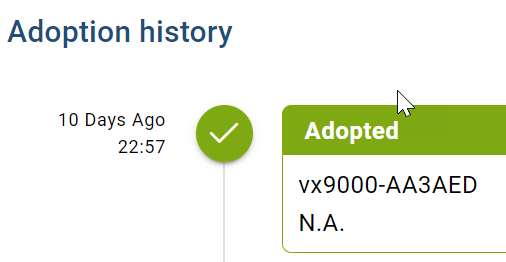

Note
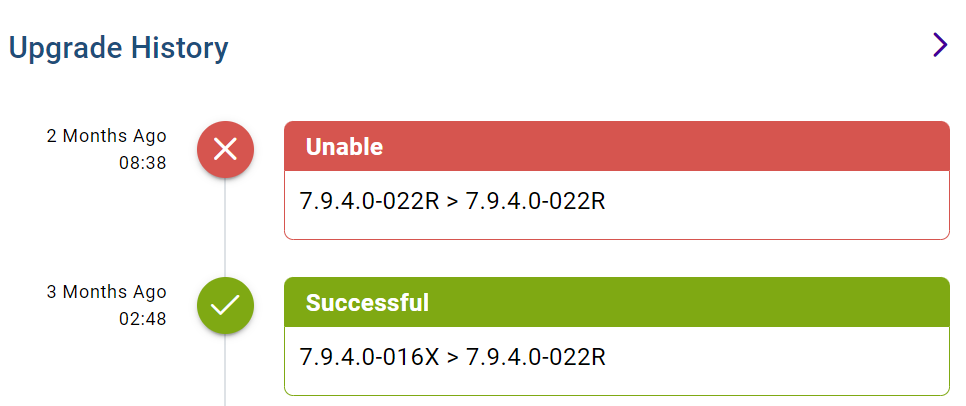
If adoption is unsuccessful, "N.A." is replaced with a reason message (for example, auto-provisioning policy issue, licensing issue, or device is unreachable).AP Statistics – Example Upgrade History Display shows an example of Upgrade History information displayed for APs in the RF Domain.
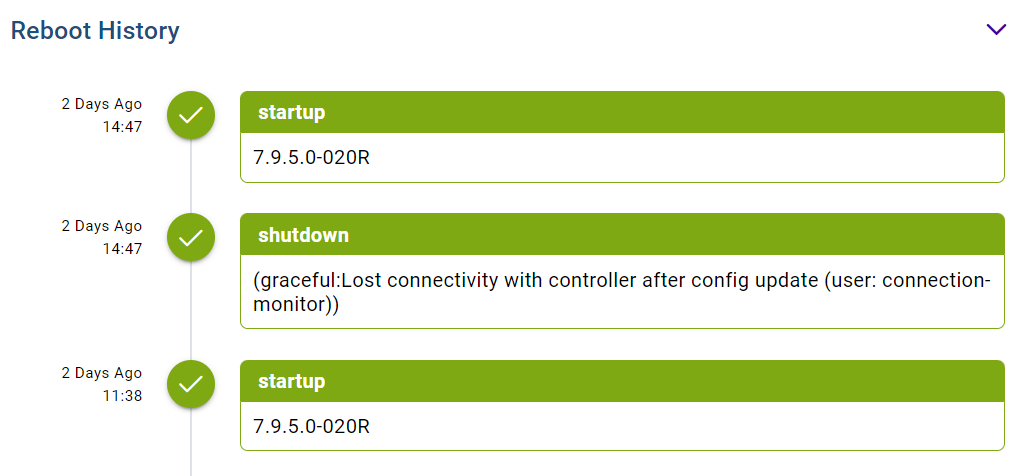
Check the Reboot History statistics to assess performance of the selected AP. If the AP reboots frequently, you can go to and consult the data recorded for the selected AP to help determine the cause.
Access Point Statistics - Example Reboot History Display shows an example of Reboot information displayed for APs in the RF Domain.