Client Performance Statistics
To view Client Statistics:
- Go to and select a target Site.
- Select a target Client.
- Scroll to the bottom of the display and select
 adjacent to Statistics to expand the display and view
client performance statistics.
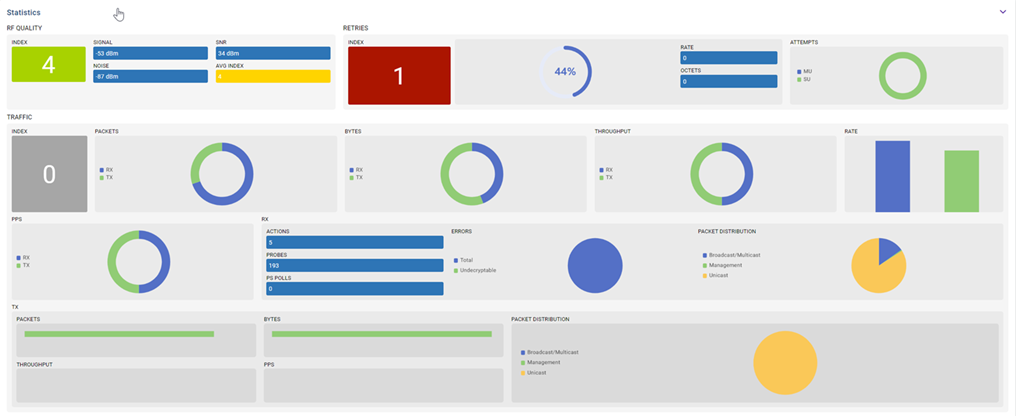
Example of Client Statistics Display shows an example of a client statistics display.

Client performance statistics are arranged under the following panes (left-to-right, top-to-bottom):
RF Quality
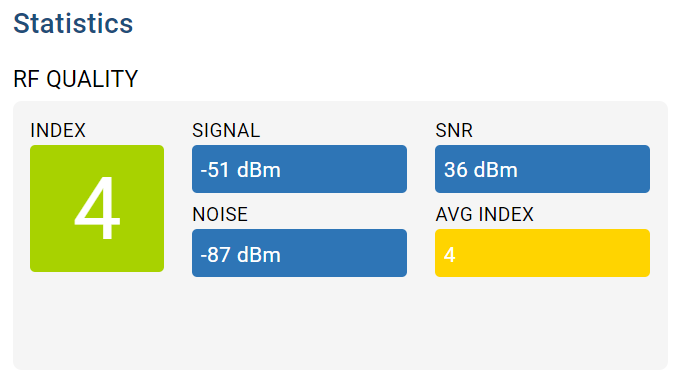
Client Performance Statistics – Example RF Quality Display shows an example RF Quality display for a client.

Client Performance Statistics – RF Quality Description describes the information displayed.
| Widget/Field | Description |
|---|---|
| Index | Displays an integer indicating the overall RF performance for the
selected client. The RF quality indices are:
|
| Signal | Displays the power of the radio signals (in –dBm) for the selected client. |
| SNR | Displays the selected client's signal-to-noise ratio (SNR). A high SNR could warrant a different access point connection to improve performance. |
| Noise | Displays the level of noise (in –dbm) in the client-connected radio signal. |
| AVG Index | Displays an integer indicating the average RF performance for the
selected client. The RF quality indices are:
|
Retries
Client Performance Statistics – Example Retries Display shows an example of a Retries display for a client.

| Widget/Field | Description |
|---|---|
| Index | Displays the average number of retries per packet (and a performance indicator). A high Index number indicates possible network or hardware problems. Assess the error rate with respect to potentially high signal and SNR values to determine whether the error rate coincides with a noisy signal. |
| Rate | Displays the average number of retries per packet. A high number indicates possible network or hardware problems. |
| Octets | Displays the total number of transmitted retried octets (bytes) with no errors. |
| Attempts | Displays the number of retry connection attempts for multi-user multiple input, multiple output (MU-MIMO) and Single-user multiple input, multiple output (SU-MIMO) transmissions between the selected client and its associated AP. |
Traffic
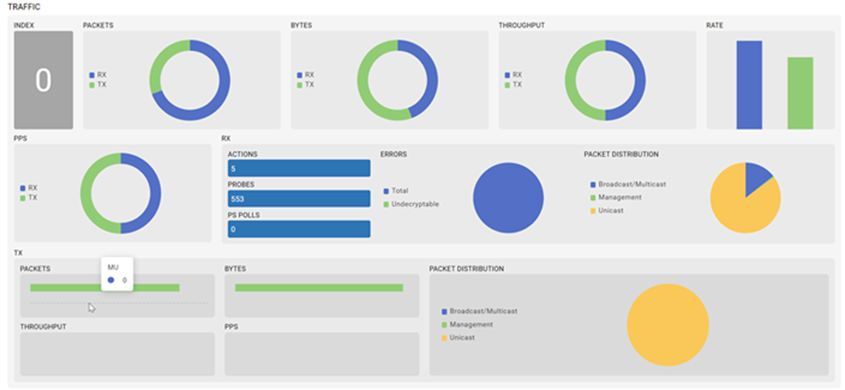
Traffic widgets display statistics on the traffic generated and received by the selected client. Hover over widgets to view detailed statistics.
Client Performance Statistics – Example Traffic Display shows an example of a Traffic display.

Client Performance Statistics – Traffic Description describes the information displayed.
| Widget/Field | Description |
|---|---|
| Index |
The traffic Index measures how efficiently the traffic medium is utilized. It is defined as the percentage of current throughput relative to the maximum possible throughput. Traffic indices are:
|
| Packets | Displays the total number of packets transmitted and received by the selected client. |
| Bytes | Displays the total TX and RX bytes processed by the selected client. |
| Throughput | Displays the total amount user data transmitted and received by the selected client (in bytes). |
| Rate | Displays the average user data rate in both directions. |
| PPS | Displays the average packet rate at the physical layer in both directions. |
| RX |
The following performance statistics are displayed:
|
| TX |
The following performance statistics are displayed:
|

