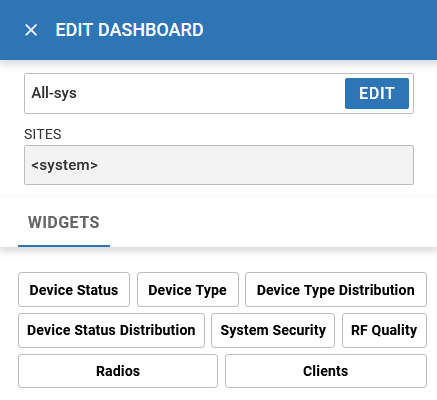
Edit or Delete a Selected Dashboard
You can customize the default dashboard views to fit your network's analytic requirements, such as monitoring the distribution, component threat levels, and device performance.
You can customize the default dashboard views to fit your network's analytic requirements, such as monitoring the distribution, component threat levels, and device performance.

Note
You cannot edit the default dashboard.

 icon on the dashboard widget.
 next to the dashboard name on the main Dashboard
toolbar.
