Debug Captive Portal Clients
An administrator can
select an RF domain and capture
captive portal client and authentication debug
messages at an administrator assigned interval and location. Captive
portal debug information can either be collected historically or in
real-time.
To troubleshoot captive
portal client debug messages:
-
Go to
to display managed RF domains.
-
Select and expand an RF domain
and click on the down arrow to the right of the RF domain‘s name.
-
Select .
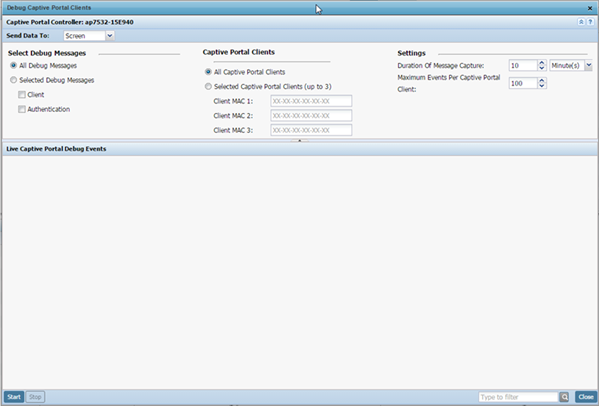
Debug Captive Portal Clients Screen
-
Use the Send Data To drop-down menu to select where
captive portal debug messages are collected.
If Screen is selected, information is sent to the
Live Wireless Debug Events window at the bottom of the
screen. If File is selected, the file location must be
specified in the File Location field.
-
In the Select Debug
Messages area, refine how captive portal client debug messages
are trended:
| All Debug Messages |
Select this option to capture all captive portal client
and captive portal authentication request events
collectively without filtering by type. |
| Select Debug Messages |
Select this option to specify the type of captive portal
event messages to display. Options include captive portal
client events and events specific to captive portal
authentication requests. |
-
Set Captive Portal Clients filter options to refine
which clients are included in the debug messages.
| All Captive Portal Clients |
Select this option to display debug information for each client utilizing a captive
portal for network access within the selected RF
domain. |
| Select Captive Portal Clients (up
to 3) |
Optionally display captive portal
debug messages for specific clients (1 - 3). Enter the MAC
address for up to three wireless clients. The information
displayed or logged to the file is only from the specified
wireless clients. Change the client MAC addresses as needed
when clients are no longer utilizing the RF domain‘s captive
portal resources. |
-
Define the following captive portal client Settings to
determine how messages are trended:
| Duration of Message
Capture |
Use the spinner controls to set
the message capture interval for captive portal debug
information. This can range between 1 second and 24
hours. |
| Maximum Events Per Captive Portal Client: |
Use the spinner controls to select
the maximum number of captive portal event messages
displayed per RF domain member client. Set the number of
messages from 1 - 9999 events with the default value being
100 events. |
-
When all configuration fields are complete, select
Start to start the
captive portal client debug message capture.
Information sent to the screen displays
in the Live Captive Portal Debug
Events field. If you have set a long message capture duration
and want to end the capture early, select Stop.
 Print
this page
Print
this page Email this topic
 Feedback
 View PDF
 Download EPUB