Deploying an Availability Pair
ExtremeCloud IQ Controller provides the availability feature to maintain service availability in the event of an outage. The Availability feature allows both AP and Client statistics to be available on both sides of the high-availability configuration.
Before you begin:- Enable NTP on both ExtremeCloud IQ Controller appliances. Go to Administration > System > Network Time and select NTP.
- On the primary ExtremeCloud IQ Controller, go to Administration > System > Availability and select Paired.
- Configure the following parameters:
- Role
- Primary
- Peer IP Address
- The data port IP address of the second ExtremeCloud IQ
Controller.

Note
The Peer IP address must refer to a physical topology of the peer appliance. It can be the IP address of a physical port or the IP address of a Lagged interface. Configuring availability against a service topology such as the IP address (L3) of a Bridged@Controller appliance is not supported. - Auto AP Balancing
- Select Active - PassiveIn a Availability Pair, an AP establishes an active tunnel to one appliance and a backup tunnel to the other appliance. The active tunnel is used to pass the client data over tunneled topologies.
- In an Active-Active configuration, approximately half of the APs establish an active tunnel to the primary appliance. The remaining APs establish an active tunnel to the backup appliance, spreading the load across the Availability Pair.
- In an Active-Passive configuration, all APs establish an active tunnel to the primary appliance. The secondary appliance is used for failover only.
In either configuration, however, most parameters can be configured on either appliance in the availability pair.
- Secure Tunnel
- Optionally, select the check box to enable a secure ICDT tunnel that uses IKE/ IPSEC.
- MTU [Bytes]
-
Use the spinner to set the Maximum Transmission Unit (MTU) to avoid data packet fragmentation. Set a value in the range 600–1800 bytes. The default value is 1500 bytes.

Note
When MTU is 1800, ensure that Jumbo Frames is enabled on the Switch.

Important
Ensure that Secure Tunnel and MTU settings are identical on both primary and secondary controllers to prevent an issue in the event the link is lost before synchronization completes. - Select Save.
- On the secondary ExtremeCloud IQ
Controller, select Paired and configure the following parameters:
- Role
- Backup
- Peer IP Address
- The IP address of the primary ExtremeCloud IQ Controller.
- Auto AP Balancing
- Select Active-Passive
- Secure Tunnel
- Optionally, select the check box to enable a secure ICDT tunnel that uses IKE/ IPSEC.
- MTU [Bytes]
-
Use the spinner to set the Maximum Transmission Unit (MTU) to avoid data packet fragmentation. Set a value in the range 600–1800 bytes. The default value is 1500 bytes.

Note
When MTU is 1800, ensure that Jumbo Frames is enabled on the Switch.

Important
Ensure that Secure Tunnel and MTU settings are identical on both primary and secondary controllers. - Select Save.
- Choose from the following actions to verify availability link status and synchronization status:

Note
It will take a few minutes for the two ExtremeCloud IQ Controller configurations to synchronize.-
From the Administration > System > Availability page, check the Availability Link Status and Synchronization Status indicators.
-
Go to Admin > Logs and look for the message
Availability Link established with Peer <ip address>. -
To verify synchronization, choose from the following actions:
-
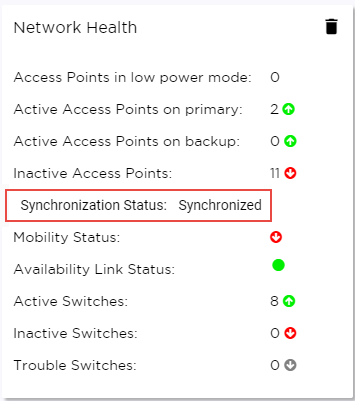
View the Network Health widget from the Diagnostics dashboard. Go to Tools > Diagnostics > Dashboard.
-
Add a network health widget to the Overview dashboard:
-
Go to Dashboard
-
Select
 to edit the dashboard.
 -
Select Widgets.
-
Select System and drag Network Health onto the dashboard.
The Synchronization Status is displayed as part of the Network Health widget. Availability Pair Synchronization Status
-
-
-
Section contents:
- Replace a Controller in an Availability Pair
Learn how to replace a faulty controller in an Availability Pair.
