Manage AlertsNEW!
Go to .
The Alerts dashboard includes:
- A list of alerts raised during the specified time range
- Interactive widgets that summarize, highlight, and logically group the alerts raised during the specified time range
- Tools that allow users to filter the alerts list, manage alerts, and configure alert policies

Note
The ExtremeCloud IQ Pilot banner displays a Notifications icon and
the total number of Unacknowledged
Critical alerts raised over the last 24 hours. Hover over the icon to view a
summary of the five most recent Critical alerts. Select View All to open the
Alerts dashboard—from any user interface—and review details of, and optionally
acknowledge, the Critical alerts.
and
the total number of Unacknowledged
Critical alerts raised over the last 24 hours. Hover over the icon to view a
summary of the five most recent Critical alerts. Select View All to open the
Alerts dashboard—from any user interface—and review details of, and optionally
acknowledge, the Critical alerts.Select Alert Policy to modify the Global Policy or to create or modify a Site Policy.
Select View Legacy Alarms to view legacy alarms.
Alert Details
By default, the Alerts dashboard displays information about alerts raised at all sites for the last 24 hours. You can filter the Alert Details list using either one or a combination of the following methods:
- Use the Sites drop-down menu to display alerts associated with a specific site.
- Use the Time Range controls to specify a time range—within the last 30 days—for which you want to display alerts.
- Use interactive widget controls to display alerts based on Severity, Alert Category, or Top 5 Alert Type.
- Use the Status drop-down list to display All (default), Acknowledged, or Unacknowledged alerts.

Note
After you set filters, if you exit the Alerts dashboard, filters are removed. You cannot save filter settings.The Alert Details pane lists alerts and related details in tabular form. Alert Details List Column Headings describes the type of information displayed in each column and the tools users can employ.
| Column Heading | Description |
|---|---|
| Severity | Displays alert severity levels, as follows:
|
| Summary | Provides an interactive description of the alert. Select the
description to open the Alert
Detail pop-up window, which displays variations of
the following information, depending on the source of the alert:
In the Alert
Detail window, choose from the following
actions:
|
| Category | Identifies the category of the alert. Possibilities are:
|
| Source | Displays an interactive device host name. Select the host name to open the window to investigate the related alert issue. |
| Detected | Indicates when the event was detected or the performance metric criteria was met. |
| Acknowledge | Identifies the acknowledgment status of the alerts, as
follows:
Choose from the following actions:
|
Alerts Summary
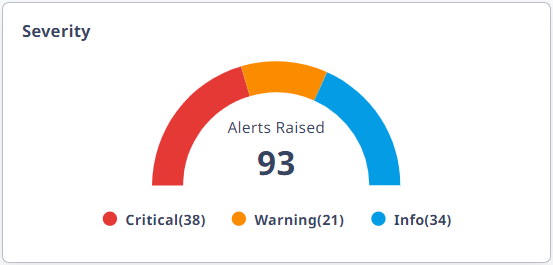
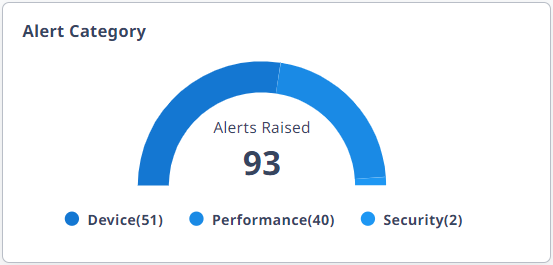
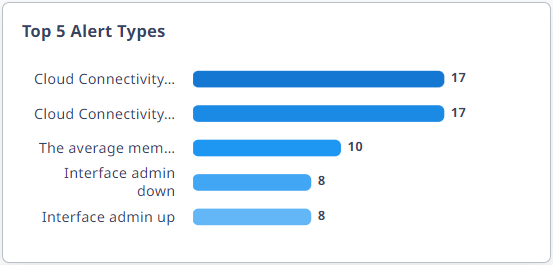
Alert widgets provide a graphical summary of alerts and include color-coded refinements based on severity, category, and most prolific types of alerts. Widgets are interactive, allowing users to filter the alerts in the Alert Details list based on the refinements.

This widget displays the total number of Alerts Raised for the specified time range, with the colored bands of the arch and color-matched beads below it representing refinements on the basis of Severity, as follows:
- Critical
- Warning
- Info
Select a colored band in the graphic, or a bead, to filter the Alert Details list on the basis of Severity.

This widget displays the total number of Alerts Raised in all categories for the specified time range. Colored bands of the graphic and color-matched beads below it represent refinements based on Alert Category, as follows:
- Device
- Performance
- Security
Select a colored band in the graphic or a bead to filter the Alert Details list on the basis of Alert Category.

This widget displays the five most prolific alert types raised for the specified time range. Select a colored band in the graphic to filter the Alert Details list on the basis of Alert Type.


