Connection Details Panel (Wireless)
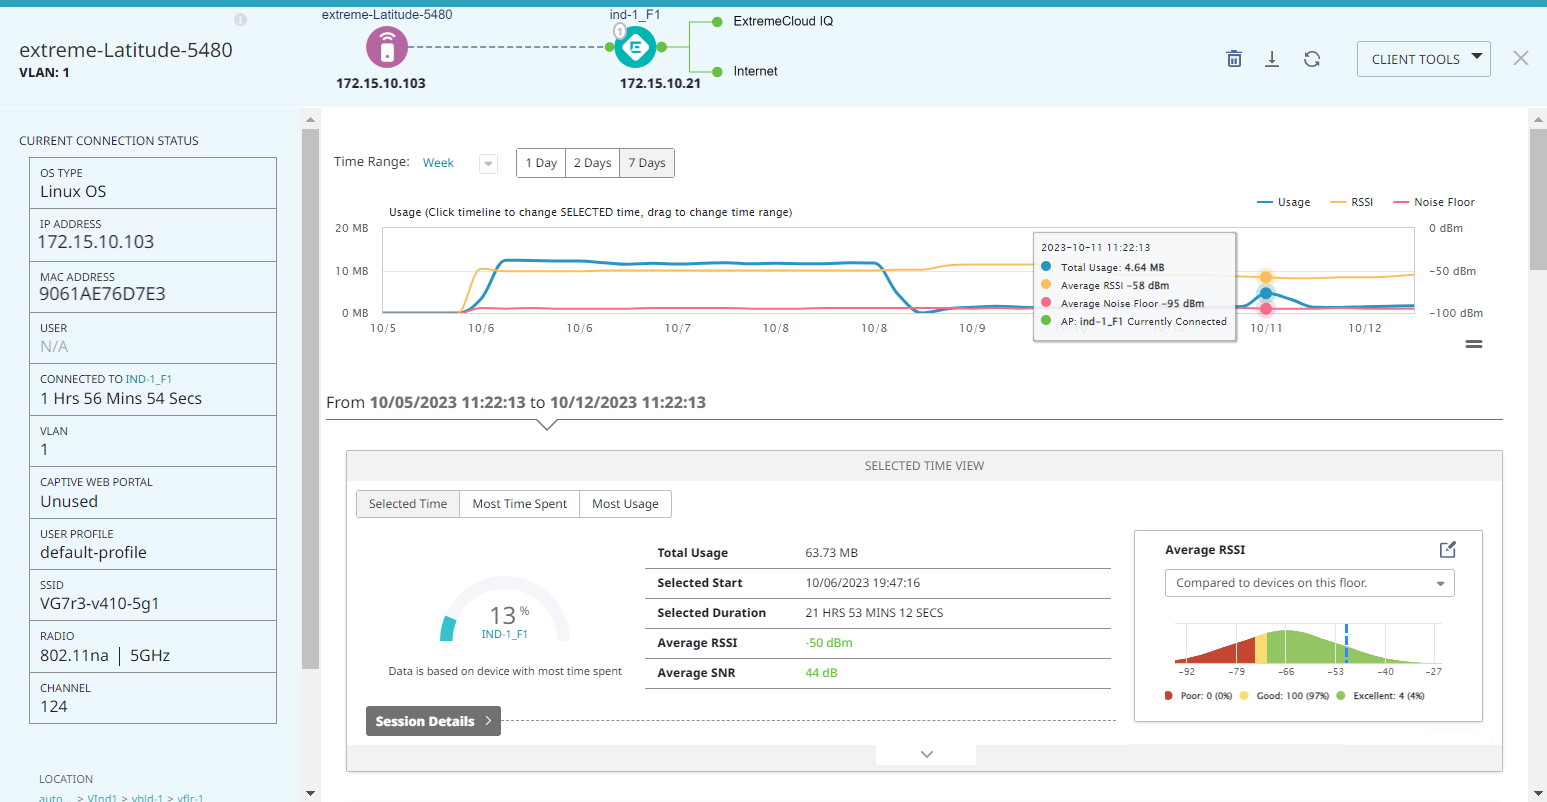
The connection details panel lists details about the current or last connection in a column to the left of the interactive widgets and tables.

The initial graph displays information about data usage, RSSI, and the noise floor. Use the Time Range menu to change the time period. Select from the following options:
- Day (1 Hour, 2 Hours, 4 Hours, 8 Hours, or 24 hours)
- Week (1 Day, 2 Days, 7 Days)
- Month (7 Days, 14 Days, 30 Days, or 90 Days)
- Custom (Use the Calendar controls to select the date range.)
Select one of the tabs to display relevant information:
- Selected Time
- Most Time Spent
- Most Usage

To expand the SELECTED TIME VIEW section, select Session Details >. For more information, see Session Details (Wireless).
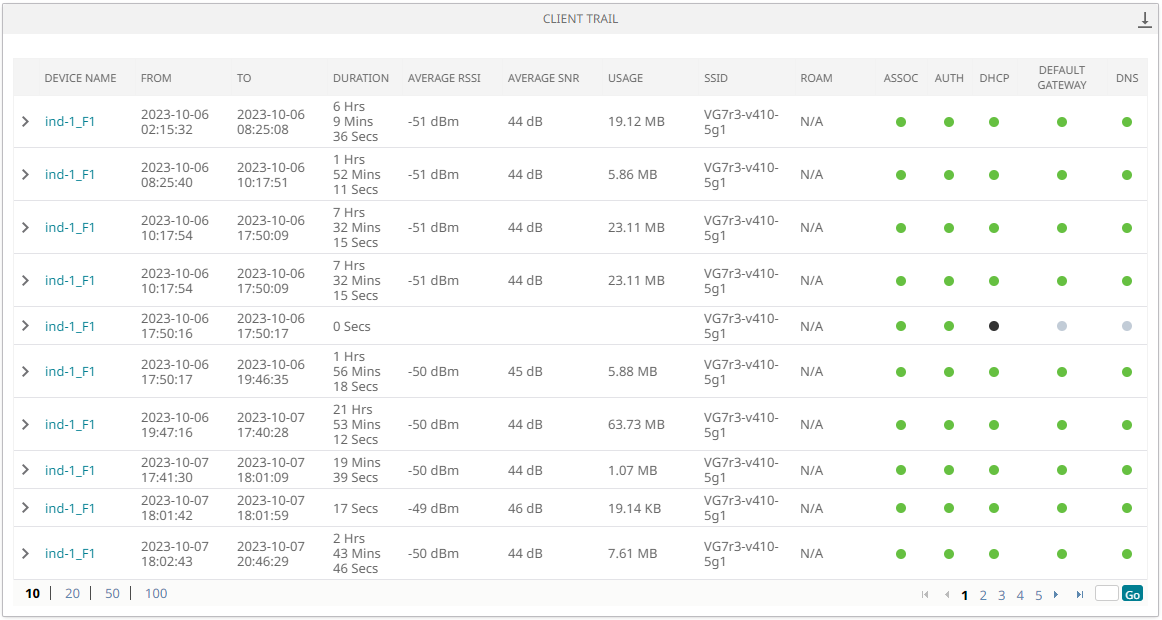
The CLIENT TRAIL table displays information about device connections. Display 10, 20, 50, or 100 results per page. Navigate pages by selecting the page number, or enter a page number and select Go. Color-coded connection status icons provide at-a-glance status information. Mouse over the icons for descriptions.

To download the results as a CSV file, select ![]() . To see more detailed information, select a device in the Device Name column.
See Device Details Panel (Wireless).
. To see more detailed information, select a device in the Device Name column.
See Device Details Panel (Wireless).
The TROUBLESHOOT SESSIONS table displays in-progress and completed troubleshooting sessions.

To download the results for a session, select the corresponding ![]() icon. For more information about troubleshooting sessions, see Client Tools (Wireless).
icon. For more information about troubleshooting sessions, see Client Tools (Wireless).
The CLIENT EVENTS table displays client events. Filter the events according to phase:
- All
- Association
- Authentication
- IP Assignment

To download the results as a CSV file, select ![]() .
.
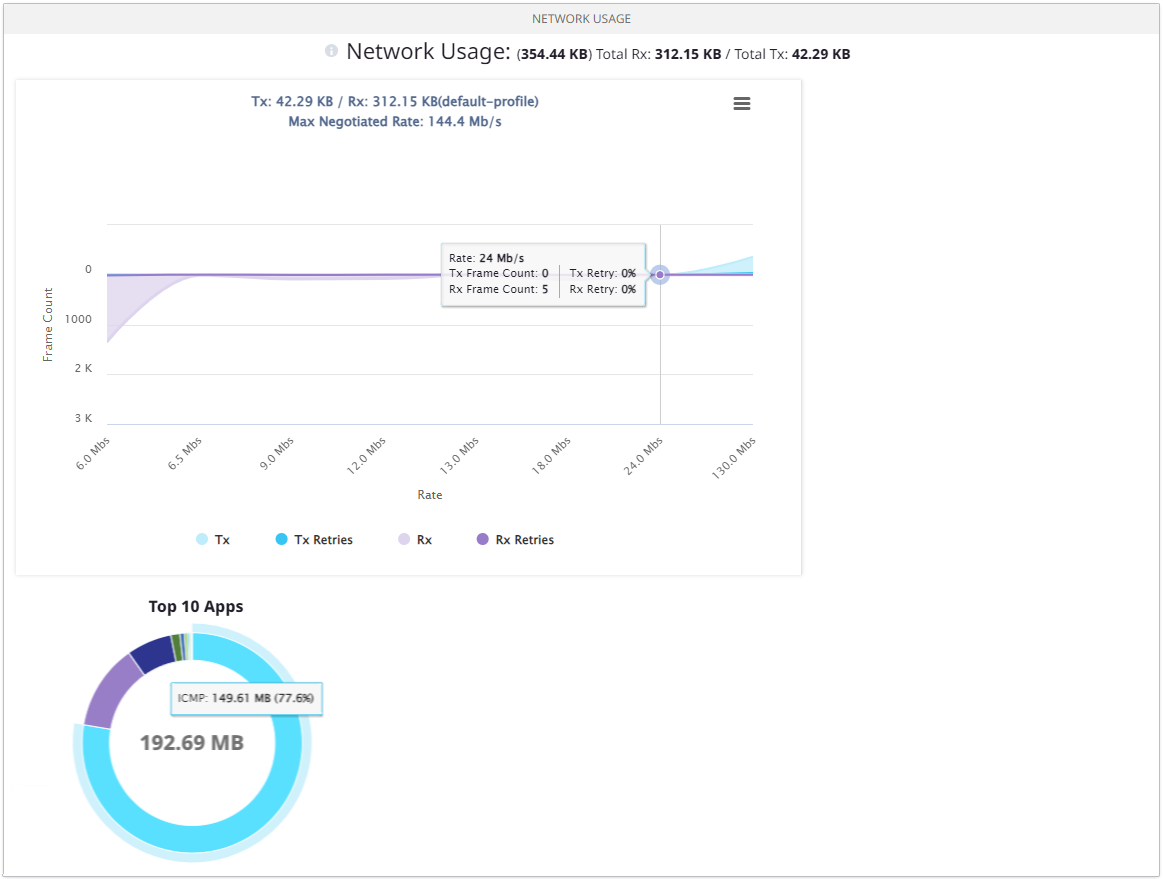
The NETWORK USAGE section displays usage information in an interactive graph and Top 10 Apps widget. Mouse over points on the graph for details. From the hamburger menu, choose from the following options:
- Print chart
- Download PNG
- Download JPEG
- Download PDF
- Download SVG vector image

Mouse over the Top 10 Apps widget to display information about app usage.
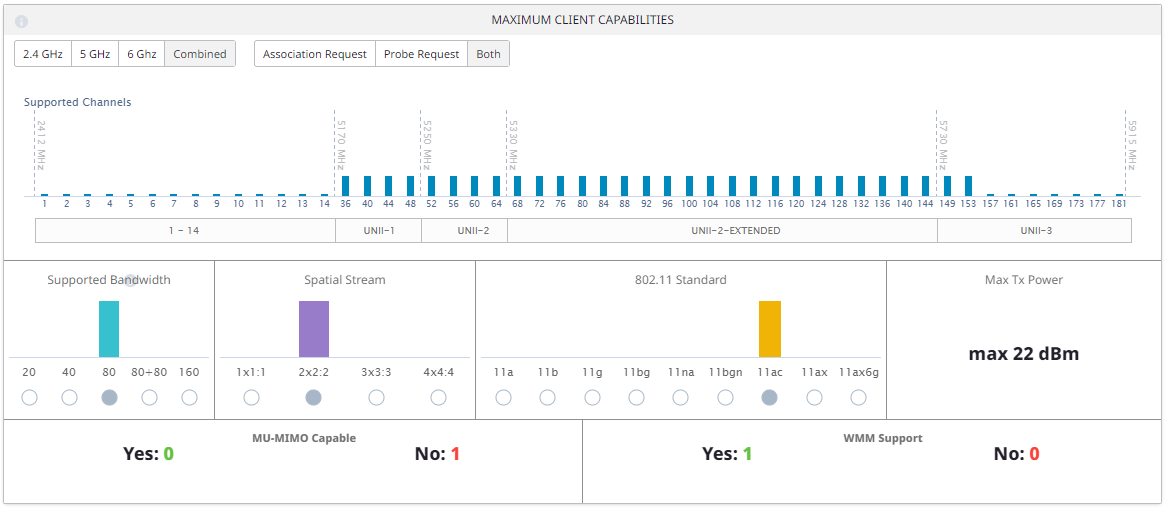
The MAXIMUM CLIENT CAPABILITIES widget displays the maximum client capabilities for all 2.4 and 5 GHz Wi-Fi clients connected to the AP during the selected period.


