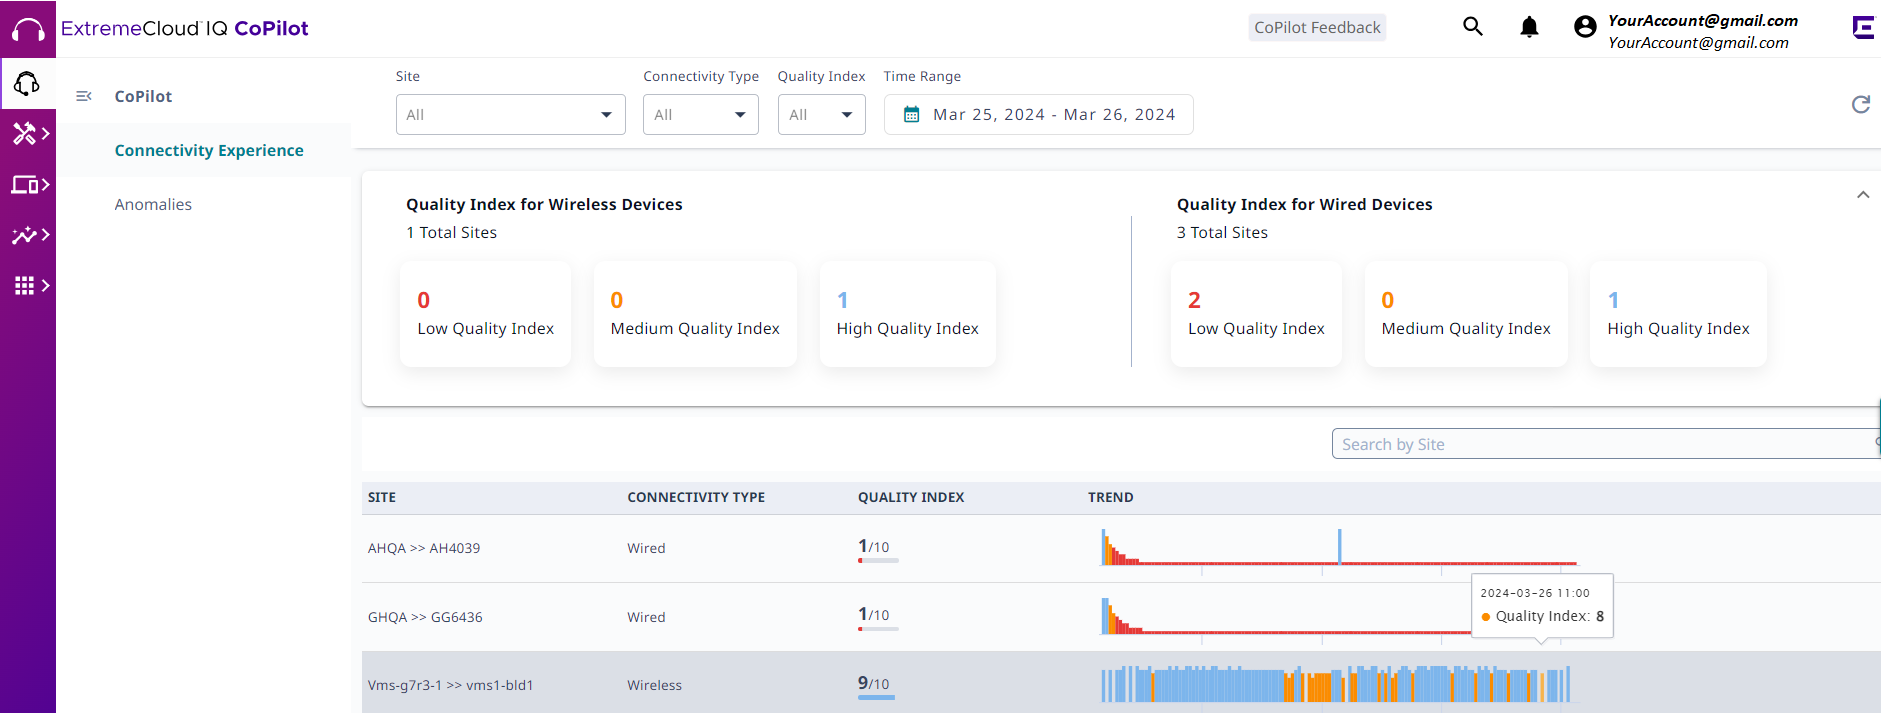
Connectivity Experiences TableNEW!
The Connectivity Experiences table displays connection quality information for the previous 24 hours, and includes the following information for each entry:
- Site
- Connectivity Type
- Quality Index
- Trend
The table displays connection quality information for the previous 24 hours. Use the controls found at the top of the page to customize your view of the table:
- Site
- Display all sites (default)
or select a specific site from the menu. Start typing a site name to search
the menu for a particular site.
To return to the default view, select X.
- Connectivity Type
- Display all clients
(default), or select only wireless, or only wired clients.
To return to the default view, select X.
- Quality Index
- Select Low (1–5), Medium
(6–8), or High (8–9). The table updates to display the wired and wireless
sites that match your selection.
To return to the default view, select X.
- Time Range
- Use the calendar control to
select the time period for which you want to display connection quality
trends information. Select the calendar control to open it and then select
one of the options:
- Last 24 Hours
- 7 Days
- Custom
Select the start date and time, and then select the end date and time for the period.
- Search by Location
- Start typing a site name to search the table for a site. Select X to clear the search string and return to the previous table view.
To sort the table results in ascending or descending order according to
Site.
Hover the mouse to the right of the corresponding column label, and select the
![]() . To change the sort order again, select the
. To change the sort order again, select the ![]() . You can also search for connection quality information by site. Use the
Items per
page menu to specify the maximum number of results to show, per
page.
. You can also search for connection quality information by site. Use the
Items per
page menu to specify the maximum number of results to show, per
page.


