Print
this page
Print
this page Email this topic
 Feedback
 View PDF
 Download EPUB
Traceroute
Traceroute allows you to display the route (path) and measure transit delays of packets across an Internet Protocol (IP) network. The trace of the route appears as the round-trip times of the packets received from each successive device (remote node) in the route (path); the sum of the mean times in each hop indicates the total time spent to establish the connection. Traceroute proceeds unless all (three) sent packets are lost more than twice, then the connection is lost and the route cannot be evaluated.
To run traceroute from OneController:
-
On the left navigation bar, click
System Configuration, and then, on the menu bar,
click Diagnostics.
The Diagnostics screen appears (see the following
figure).
 Diagnostics Screen
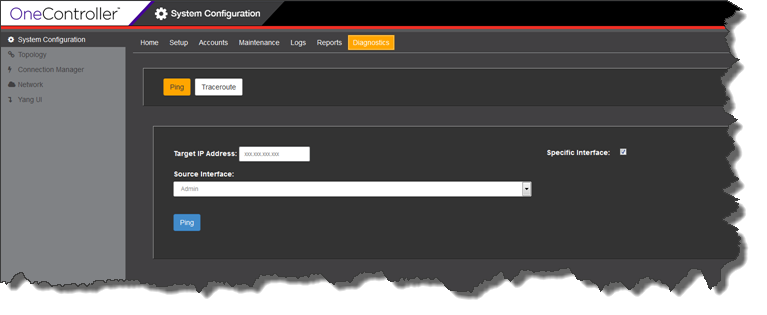
-
Click Traceroute.
The Diagnostics Traceroute screen appears (see the
following figure).Diagnostics Traceroute Screen
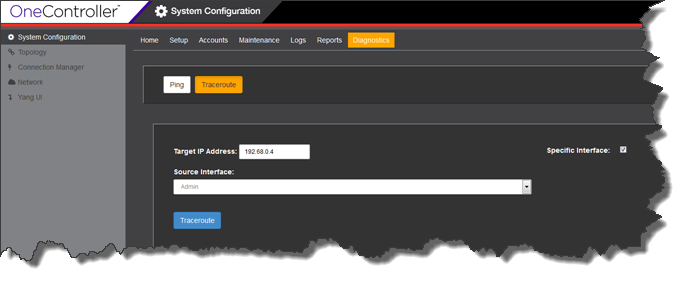
- In the Target IP Address box, type the IP addresss of the device that you want to run the traceroute to.
- To run traceroute from a specific OneController interface, select the Specific Interface check box, and then select the interface from the Source Interface drop-down list: Admin, esa0, esa1, eas2 (OneC-A-600 only).
-
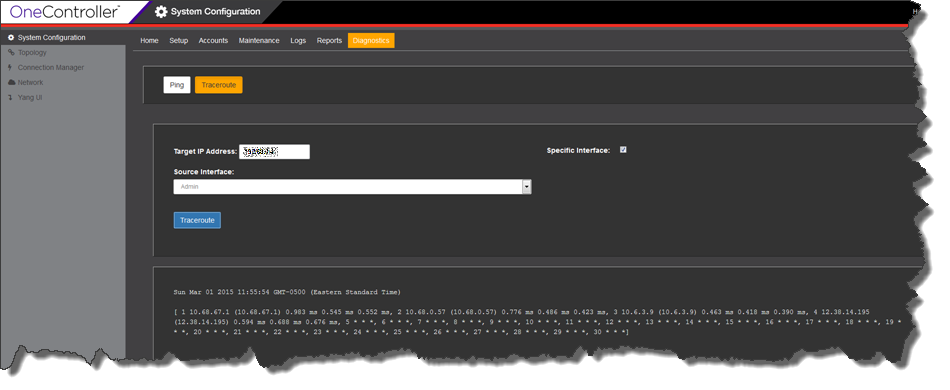
Click Traceroute.
The traceroute results appear below (see the following figure).Diagnostics Traceroute Screen (Results)