Modify a Dashboard
You can customize the default dashboard views to fit your network's analytic requirements, such as monitoring the topology, component health, and device performance.
To modify a dashboard:
-
From the Overview Dashboard
page or from the dashboard page of a specific entity, such as a device, select
Edit.
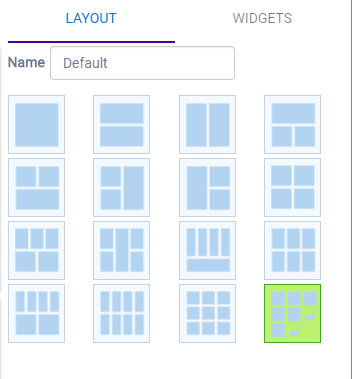
The Layout and Widgets tabs display on the far right.
 Dashboard - Edit Mode
- From the Layout tab, select a layout.
-
From the Widgets tab,
expand the categories that you want to use. Select the widgets that you want
included in the layout. The following widget categories are available:
- Utilization
- Provides utilization metrics such as client count, and various top 10 and bottom 10 counts. Separate widgets display statistics for multiple networks, providing the ability to compare multiple SSIDs for client count, utilization, and throughput. Also includes AP status and the Up/Down/Unassigned status of APs.
- RF
- Provides Radio Frequency metrics such as RF quality, RF health, channel utilization, and various top 10 and bottom 10 metrics. This group also includes various Smart RF metrics.
- Switch
- Tracks top and bottom switches by throughput.
- Clients
- Tracks client distribution based on different parameters.
- Captive Portal
- Provides captive portal related information such as associated guests and dwell time.
- Application Visibility
- Provides application visibility metrics.
- System
- System metrics indicate network health.
- Troubleshooting
- Provides a packet capture list and Poll site statistics.
- Select Save.
