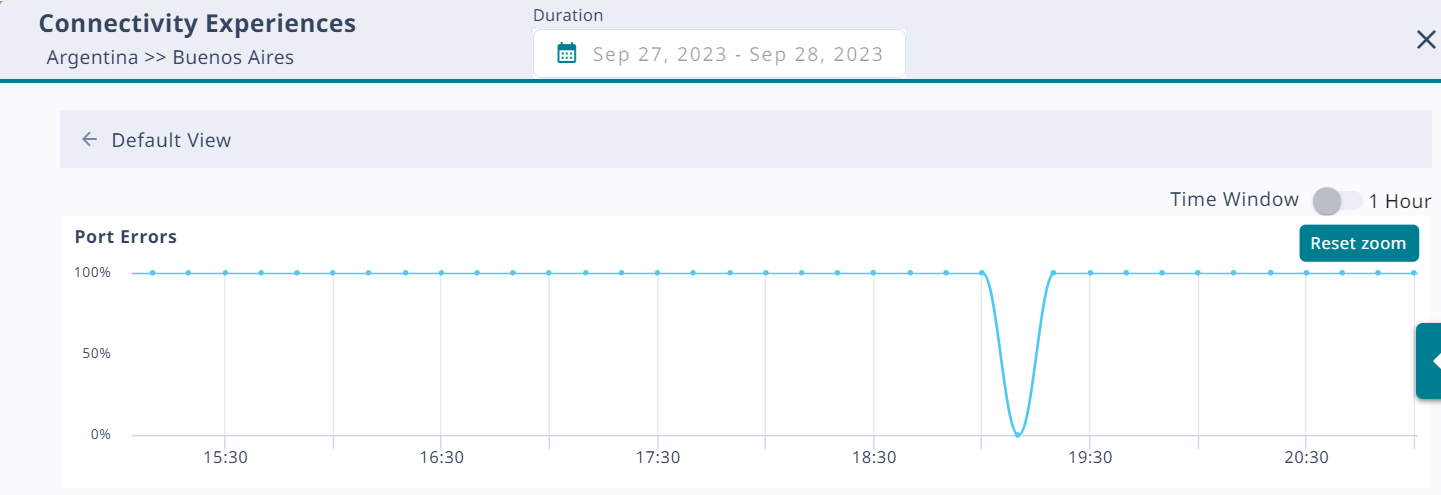
Port Errors
To zoom in on the Port Errors graph, drag and select a time period.
Port Errors

To zoom back out again, select Reset zoom. To return to the Default View, select the back arrow.
Port Errors Zoom

Select a point on the Port Errors graph to update the table with relevant information.
Affected Ports Table

The system calculates the metrics that appear in the graph and in the table over a 10-minute period. To change the period to one hour, select the Time Window toggle.
Search the table by host name, MAC address, SSID, or operating system (OS).
Related concepts

