To create a new report:
 icon.
icon.
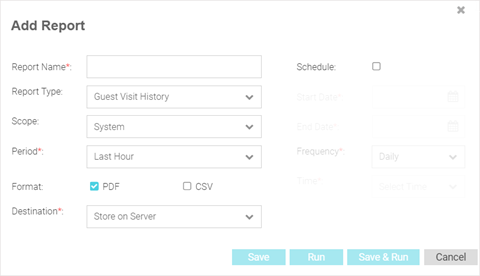
| Report Name | Specify a unique name for the new report. This setting is mandatory. | ||||||||||||||||||||||||||
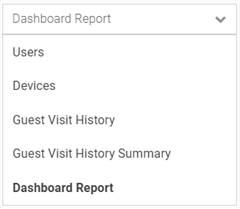
| Report Type | Select the report
type. There are five different types of reports that can be
created:
|
| Scope | Use the Scope menu to navigate the system tree and select which sites to include in the report. To include all site, select System. |
| Period | Select the time
period for the report to include. Available options are:
|
| Format | Select an output
format to generate the report in. Available options are:
 Note The CSV format is applicable only for the Guest Visit History and Guest Visit History Summary reports. |
| Destination | Select a destination
to save the reports to. Available options are:
|
| Recipient Email | When Store & Mail is selected in Destination, specify the e-mail address to send the report to. |
| Email Policy | When Store &
Mail is selected in Destination, use the pull-down menu to select an
e-mail policy to use when sending the report. To create a new policy
go to and select the icon. |
 Print
this page
Print
this page Email this topic
 Feedback
 View PDF
 Download EPUB