Elasticsearch: http://<host_ip>:30920
Kibana: http://<host_ip>:30601
@timestamp:December 13th 2018, 22:18:12.929 source
:/var/log/dcapp/fabric/fabric.log offset:513,560 message:{"level":"info","msg":
"Fabric service Health status OK ","time":"2018-12-12T18:03:04Z"} prospector.type:log
json.level:info json.msg:Fabric service Health status OK json.time:2018-12-12T18:03:04Z
beat.name:5d2a1a83ed27 beat.hostname:5d2a1a83ed27 beat.version:6.2.2 _id:
YdN4qGcBzheJSFbXB7U5 _type:doc _index:filebeat-6.2.2-2018.12.13 _score:1
| Tag | Description |
|---|---|
| source | Provides the information about which service the log belongs to. |
| level | Provides the level of log, for example, whether a log is “Error” or “Info” or “Warning”. |
| _id | Each log is numbered with a unique ID. |
| json.msg | Contains details about the operation or error message in this field. |
| timestamp | Details about when the operation was performed. Gives exact time of log creation. |
# docker logs k3s
To obtain a <container-id>, run docker ps.
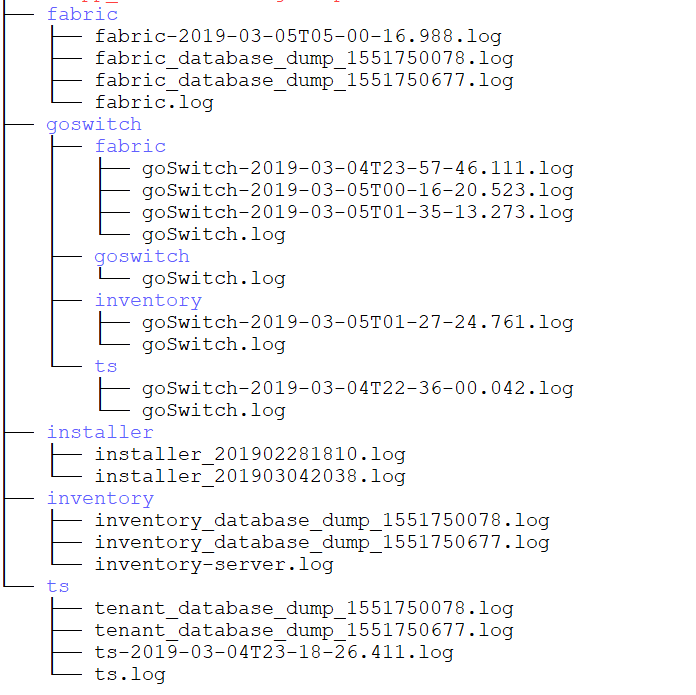
The ELK stack is deployed as part of the deployment, which helps analyze the
application-specific logs. Logs for the services are available in the host at
/var/log/efa.
Application level
The ELK stack helps analyze the application-specific logs. Logs for the services are available in the host at /apps/efa_logs.
Logs are visualized on a Kibana dashboard. The following is an example.
