RADIUS Server related authentication metrics are provided for troubleshooting the ExtremeCloud IQ
Controller RADIUS
interface.
Report Duration
From the top of the Dashboard page:
Select to set the
Duration value for
the time period reported. Valid duration values are:
Last 3 hours
Last 3 days
Last 14 days
Select to refresh the
data on demand.
Hover the mouse over a widget to display
tool tip information.
Go to Tools > Diagnostics > RADIUS
Servers to view the following widgets.
Health
The Health tab
displays data that indicates the condition of the RADIUS servers. The Servers list
provides data on the percentage of clients affected by the following:
Server Unreachable
This scorecard indicates the amount of time that the RADIUS server is
unreachable.
The GUI label X%/Y minutes represents the
following metrics:
Y is the
number of minutes the server is down
X% is the
number of minutes the server is down (Y) divided by the
total sample period in minutes
The total sample period can be measured in any of the report duration values.
Dot 1x Excessive Failures
This scorecard indicates that the RADIUS connection is unstable,
resulting in unsuccessful Dot 1x Transactions. The scorecard shows
when the failed rate percentage is greater than 20% for the selected
duration period. It also shows the number of clients disconnected
during this period due to RADIUS issues.
Criterion: Defined by the
change in transactions failed per sample period divided by the change in
transactions issued per sample period is > 20%.
The GUI label
X%/Y
minutes represents the following metrics:
Y is the
number of minutes where the criterion is True
X is the
number of minutes where the criterion is True (Y) divided by
the total sample period in minutes
The total sample period
can be measured in any of the report duration
values.
Excessive Delay
The scorecard indicates when the RADIUS request RTT is greater than
500ms for the selected duration period. It also shows the number of
clients disconnected during this period due to RADIUS issues.
Criterion: Defined as RADIUS response divided by round trip time is
> 500ms.
The GUI label X%/Y minutes represents the
following metrics:
Y is the
number of minutes where the criterion is True
X is the
number of minutes where the criterion is True (Y) divided by
the total sample period in minutes
The total sample period
can be measured in any of the report duration
values.
Select a server from the list and view widget data.
Expert
The Expert tab
provides a comparison between selected servers for the same data points. Select the
servers from the Servers list and select Apply.
Server List
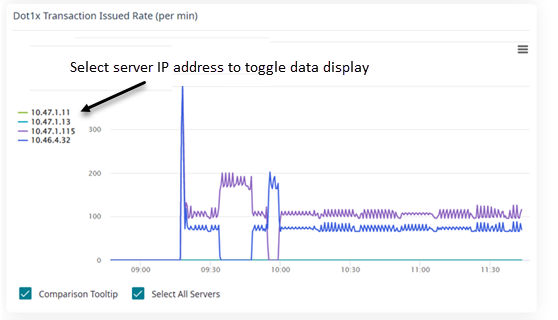
Additionally, you can take the following actions on each chart:
To show or hide specific
server chart data, from the key for each chart, select an individual server
IP address.
Toggle data display
To zoom in, select an area of
the chart and drag. To return to the original zoom, select Reset
Zoom.
Chart Zoom
You can also select:
Show All
Servers — To compare all servers. This refers to all selected servers. If a server is not selected
at the top of the page, it is not included in Show All
Servers.
Shared Tool
Tip — To display server data in a comparison tool tip.
Shared Tooltip for
Selected Servers
Shared Tooltip for
Selected Servers shows on November, 21, 2022 at 14:20 the Dot1x Transaction Success
Rate (per minute) for five selected servers. The minimum value and
the maximum value are also displayed.
Example Widgets
The following figures illustrate how to use the Health and Expert widgets to
understand your RADIUS performance.
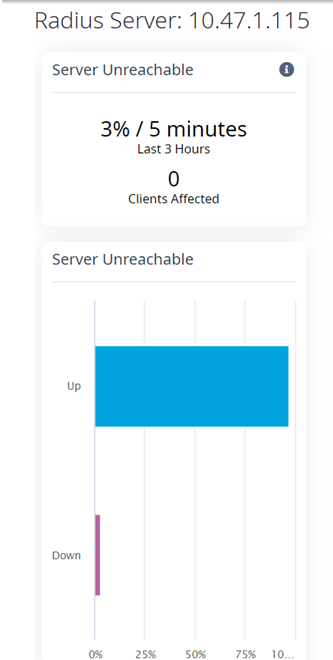
RADIUS Server Up
From the Health tab, RADIUS Server Up indicates that RADIUS Server has been Down for 5 minutes (3% of the Last 3-Hour
duration period) and no clients have been adversely affected.
Matching Sent/Received
Patterns Indicate Success
From the Expert tab, Matching Sent/Received
Patterns Indicate Success shows that the RADIUS Sent Rate pattern matches the RADIUS Received Rate pattern,
indicating that the RADIUS interface is functioning.
Server Response
Chart
From the Expert tab, Server Response
Chart shows a single RADIUS server response time before and after the server was
disconnected.
RADIUS Server Response
showing load balance and failover
 to set the
Duration value for
the time period reported. Valid duration values are:
to set the
Duration value for
the time period reported. Valid duration values are: to refresh the
data on demand.
to refresh the
data on demand.