ExtremeCloud IQ
Controller offers
detailed physical interface statistics for the selected port. View directional data
for received (Rx), transmitted (Tx), and aggregate values for network throughput,
utilization, and frame rate.
To view L2 Port throughput and directional packet transfer rates:
Go to Administration > System > Interfaces, and scroll down to the L2 Port
pane.
Select Details for
the selected port or selected LAG.
The top left displays the port MAC Address and Port Speed.
The following graphical widgets are displayed:
Utilization
Represents the ratio of
current network traffic to the maximum traffic that the port can handle,
indicating the network bandwidth usage.
Throughput
Represents the amount of
data that transmits.
Frame Rate
Represents the speed at
which images or frames are captured or displayed, measured in fps
(frames per second).
Report Duration
From the top of the Port
Details page:
Select to set the
Duration value for
the time period reported. Valid duration values are:
Last 3 hours
Last 3 days
Last 14 days
Select to refresh the
data on demand.
Hover the mouse over a widget to display
tool tip information.
Note
The widgets report data at the 30-second level of
granularity when users select either a 3-hour or 3-day duration chart, and the
widgets report data at a 2-minute granularity level when users select the 14-day
duration chart.
Example Widgets
The following figures illustrate how to use the widgets to understand data transfer
for the selected port.
L2 Port Utilization - Zoom
with graph key
L2 Port Throughput –
Aggregate display
L2 Port Frame Rate -
Aggregate display
Chart Actions
Select to take the
following actions from the chart menu:
View in full screen
Print chart
Download chart data in any of
the following supported formats:
PNG
JPEG
PDF
SVG vector image
Select the chart label, Transmitted, Received, or
Aggregated
to toggle the chart display.
Charts showing toggle
feature
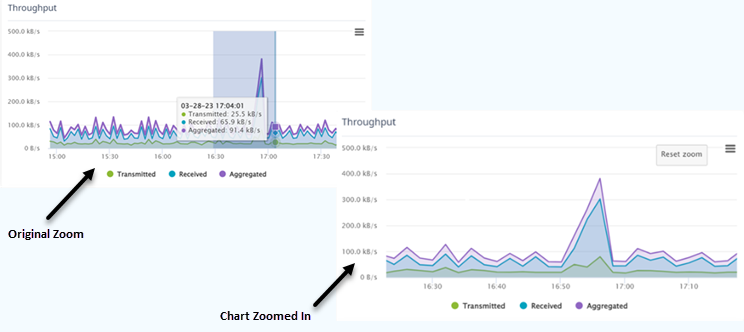
To zoom in, select an area of the chart and drag. To return to the original zoom,
select Reset
Zoom.
Chart Zoom
Note
Due to a possible
resolution limitation in the graphical display, large spikes in data may not
display in Original Zoom. In this case, hover over the chart to display
available values in the tooltip. Then, zoom in to view a graph of a limited area
in the chart.
 to set the
Duration value for
the time period reported. Valid duration values are:
to set the
Duration value for
the time period reported. Valid duration values are: to refresh the
data on demand.
to refresh the
data on demand.


 to take the
following actions from the chart menu:
to take the
following actions from the chart menu: