 AP Dashboard
ExtremeWireless offers a dashboard of statistical information for each AP in the network. The following information is displayed for each AP:
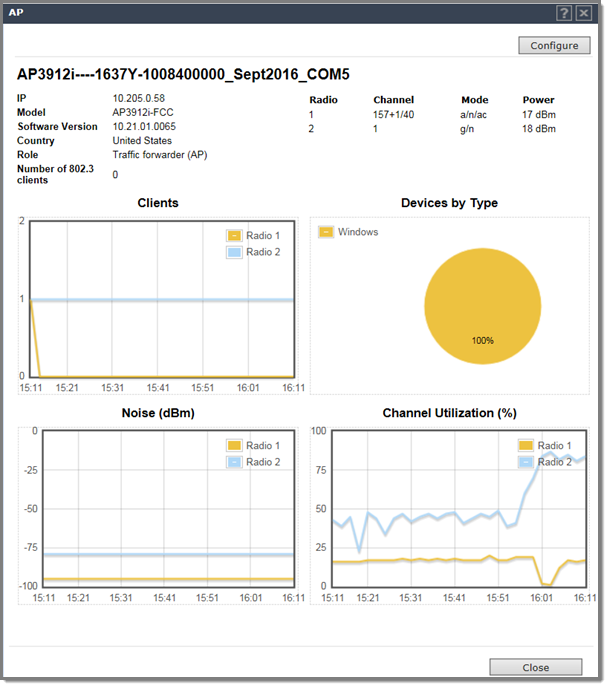
Clients
Displays the number of clients on each radio in 10-minute intervals. Use this information to gain visibility over time into AP utilization per radio. Details for the AP3912 show the number of 802.3 clients. These are clients that utilize the wired client ports that are available on the AP3912.
Devices by Type
Offers visibility into the type of devices connected to your network by percentage. Use this information to understand the BYOD usage on your network.
Noise (dBm)
Tracks the noise level for each AP radio in 10-minute intervals. Use this information to understand channel performance over time.
Channel Utilization (%)
Tracks the percentage of traffic on each radio. Use this information to understand channel usage over time, in 10-minute intervals.
Click Configure to display configuration options for the AP. For more information, see AP Properties Tab Configuration.
 Print
this page
Print
this page Email this topic
 Feedback
 View PDF
 Download EPUB