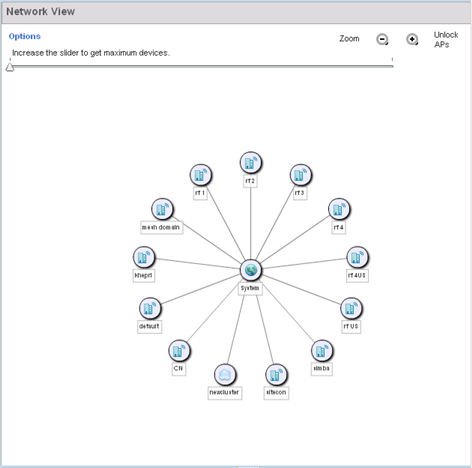
The Network View screen displays device association connectivity among wireless controllers, service platforms, access points, and wireless clients. This association is represented by a number of different graphs. Use this view to assess whether controllers and access point radios are properly deployed in areas where high volumes of client traffic are anticipated.
To review the Network Topology, select .
Use these icons to navigate quickly within top level groupings.
The middle field displays a Network View, or graphical representation of the network. Nodes display whether or not they are members of a cluster or mesh domain. Use this information to assess whether the topology of the network has changed in such a manner that devices need to be added or moved. This field changes to display a graphical network map.
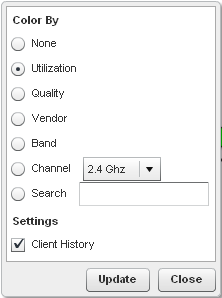
| None | Select this option to keep the Network View display as it currently appears, without any additional color or device interaction adjustments. |
| Utilization | Select this option to filter based on the percentage of current throughput relative to maximum throughput. Utilization results include: Red (Bad Utilization), Orange (Poor Utilization), Yellow (Fair Utilization) and Green (Good Utilization). |
| Quality | Select this option to filter based on the overall RF health. RF health is a ratio of connection rate, retry rates, and error rates. Quality results include: Red (Bad Quality), Orange (Poor Quality), Yellow (Fair Quality) and Green (Good Quality). |
| Vendor | Displays the device manufacturer. |
| Band | Select this option to filter based on the 2.4 or 5.0 GHz radio band of connected clients. Results include: Yellow (2.4 GHz radio band) and Blue (5.0 GHz radio band). Selecting band is a good way to determine whether 2.4 and 5.0 GHz radios are optimally deployed in respect to the access point client loads on both bands. |
| Channel | Use this drop-down menu to filter whether device connections should be displayed in either the 2.4 or 5.0 GHz band. |
| Search | Enter search criteria in the provided text field and select the Update button to isolate located variables in blue within the Network View display. |
Use the Lock / Unlock icon in the upper right of the screen to prevent users from moving APs around within the specified area.