The Inventory tab
displays information for the devices managed by the system. This screen enables a system
administrator to have a complete overview of the number and state of managed devices.
Information is displayed in easy to read tables and graphs. The Inventory screen also
provides links for the system administrator to get detailed information.
To assess the controller or service platform
inventory:
Select Dashboard →
Summary.
Expand the System node to
display RF domains.
Select and expand an RF domain to
expose its member controllers or service platforms.
Select a controller or service
platform. The Health tab displays by default.
Select the Inventory tab.
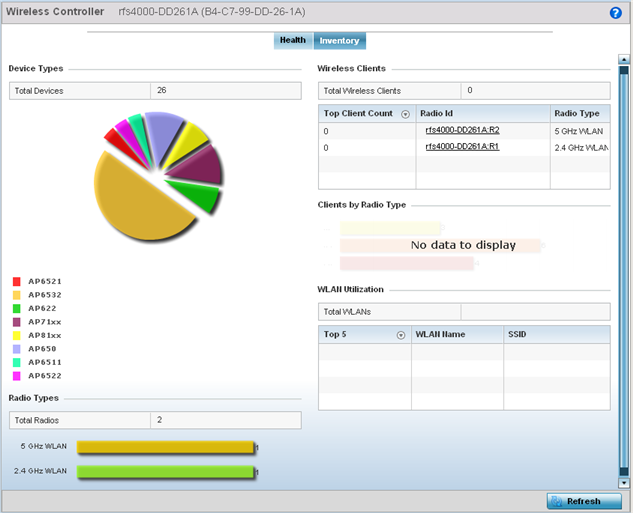
Wireless Controller
Screen - Inventory Tab
Refer to the following Inventory data:
The Device Types field
displays a ratio of devices managed by this controller or service platform in pie
chart format. The Device Type area displays an exploded pie chart that displays
the type of device and their numbers in the current system.
The Radios Type field
displays the total number of radios managed by this controller or service
platform. The graph lists the number of radios in both the 2.4 GHz and 5 GHz radio
bands.
The Wireless Clients
table lists clients managed by this controller or service platform by connected
client count. Information is presented in two (2) tables and a graph. The first
table lists the total number of clients managed by the listed controller or
service platform. The second lists the top five (5) radios in terms of the number
of connected clients. The graph just below the table lists the number of clients
by radio type.
The WLAN Utilization
table displays utilization statistics for controller or service platform WLAN
configurations. Information displays in two tables. The first table lists the
total number of WLANs managed by this system. The second table lists the top five
(5) WLANs in terms of the usage percentage along with the name and network
identifying SSID.