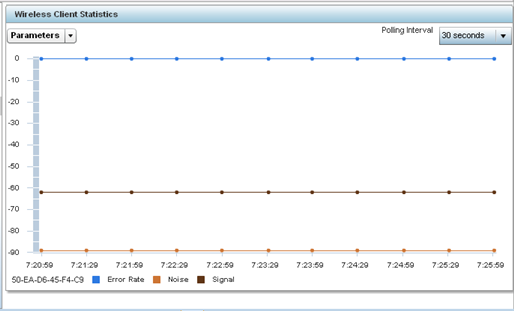
Client Graph
Use the Graph to assess a connected client's radio performance and diagnose performance issues that may be negatively impacting performance. Up to three selected performance variables can be charted at one time. The graph uses a Y-axis and a X-axis to associate selected parameters with their performance measure.
To view a graph of this client's statistics:
- Select the Statistics menu from the Web UI.
- Select System
from the navigation pane (on the left-hand side of the screen). Expand an
RF Domain, select a controller, an access point, then a connected client.
- Select Graph.
- Use the Parameters drop-down menu to
define from 1- 3 variables assessing signal noise, transmit or receive values.
- Use the Polling Interval drop-down menu
to define the interval the chart is updated. Options include 30
seconds, 1 minute, 5 minutes,
20 minutes or 1 hour. The default value is 30
seconds.
- Select an available point in the graph to list the selected
performance parameter, and display that parameter's value and a time stamp of when it
occurred.