To conduct fault management on an access point:
Select .
The screen displays by default. Use this screen to configure how events are tracked. By default, all events are enabled, and an administrator has to turn off events that do not require tracking.

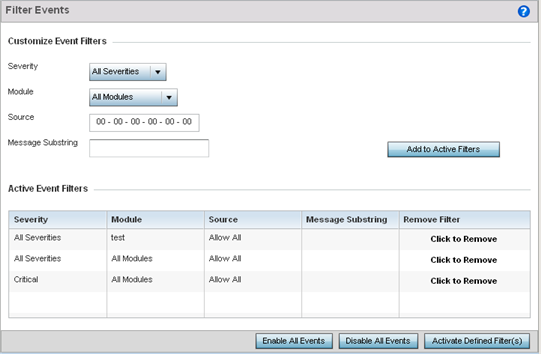
Use the Filter Events screen to create filters for managing detected events. Events can be filtered based on severity, module received, source MAC, device MAC and client MAC address.
Define the following Customize Event Filters parameters for the Fault Management configuration:
|
Severity |
Set the filtering severity. Select from the following: All Severities – All events are displayed, irrespective of their severity Critical – Only critical events are displayed Error – Only errors and above are displayed Warning – Only warnings and above are displayed Informational – Only informational and above events are displayed |
|
Module |
Select the module from which events are tracked. When a module is selected, events from other modules are not tracked. Remember this when interested in events generated by a particular module. Individual modules can be selected (such as TEST, LOG, FSM etc.) or all modules can be tracked by selecting All Modules. |
|
Source |
Set the MAC address of the source device to be tracked. Setting a MAC address of 00:00:00:00:00:00 allows all devices to be tracked. |
|
Message Substring |
Optionally append a text message (substring) to the event filter to assist the administrator in distinguishing this filter from others with similar attributes. |

Note
Leave the fields to a default value of 00:00:00:00:00:00 to track all MAC addresses.Select the Add to Active Filters button to create a new filter and add it to the Active Event Filters table. When added, the filter uses the current configuration defined in the Customize Event Filters field.
Refer to the Active Event Filters table table to set the following parameters:

Note
Filters cannot be persisted across sessions. They must be created every time a new session is established.