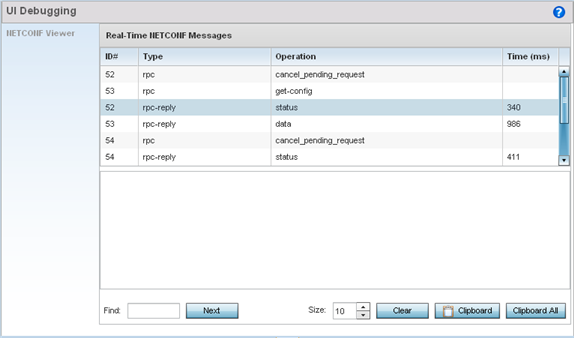
Use the UI Debugging screen to view debugging information for a selected device.
To review device debugging information:
Select Diagnostics > Advanced > UI Debugging
By default, NETCONF Viewer is selected.

Select a target ID to view its debugging information displays within the NETCONF Viewer screen.
Use NETCONF Viewer to review NETCONF information. NETCONF is a tag-based configuration protocol. Messages are exchanged using XML tags.
The Real Time NETCONF Messages area lists an XML representation of any message generated by the system. The main display area of the screen is updated in real time.
Use the Clear button to clear the contents of the Real Time NETCONF Messages area. Use the Find parameter and the Next button to search for message variables in the Real Time NETCONF Messages area.
Use the Clipboard button to copy the current selected message to the clipboard memory of the device used to access the user interface. Use the Clipboard All button to copy all the displayed messages to the clipboard memory.

 Print
this page
 Email this topic
 Feedback