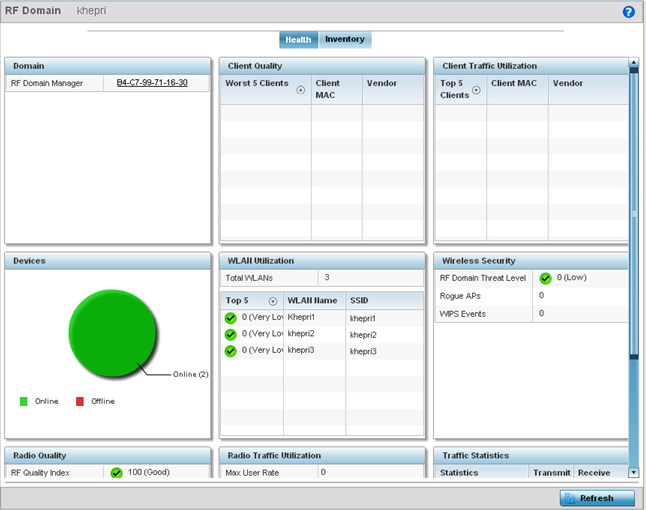
RF Domain Health
The RF Domain Health tab displays the status of the RF
domain‘s device membership. To assess the RF domain component
health:
-
Select
.
-
Expand the
System node to display RF domains.
-
Select an RF
domain.
The RF Domain Health tab displays by default.
RF
Domain Screen - Health Tab
-
Refer to the
following RF domain health information for member
devices:
- The
Domain field lists the RF domain
manager reporting utilization statistics. The MAC
address displays as a link that can be selected to
display RF domain information in at more granular
level.
- The
Devices field displays the total
number of devices and the status of the devices in
the network as a graph. This area displays the total
device count managed by this device and their status
(online vs. offline) as a pie graph.
-
The Radio
Quality table displays a table of RF quality
on a per radio basis. It is a measure of the overall
effectiveness of the RF environment displayed in percentage.
It is a function of the transmit retry rate in both
directions and the error rate. This area of the screen
displays the average quality index across all the defined RF
domain on the wireless controller. The table lists worst
five of the RF quality values of all the radios defined on
the wireless controller. The quality is measured as:
- 0-20
- Very poor quality
- 20-40
- Poor quality
- 40-60
- Average quality
- 60-100 - Good quality

Note
Select
a
Radio
Id to view its statistics in greater
detail.
-
Refer to the Client Quality table,
which displays RF quality for the worst five performing
clients. It is a function of the transmit retry rate in both
directions and the error rate. This area of the screen
displays the average quality index across all the defined RF
domain on the wireless controller. The quality is measured
as:
- 0-20
- Very poor quality
- 20-40
- Poor quality
- 40-60
- Average quality
- 60-100 - Good quality

Note
Select
a
Client to view its statistics in
greater detail.
-
The WLAN
Utilization displays how efficiently the
WLANs are used. Traffic utilization is defined as the
percentage of current throughput relative to the maximum
possible throughput for the WLAN. The total number of WLANs
is displayed above the table. The table displays a list of
the top five WLANs in terms of overall traffic utilization.
It displays the utilization level names, WLAN name and SSIDs
for each of the top five WLANs.
-
The Radio
Traffic Utilization displays how efficiently
the RF medium is used. Traffic utilization is defined as the
percentage of current throughput relative to the maximum
possible throughput for the RF domain. The Traffic Index
area displays an overall quality level for radio traffic and
the Max User Rate displays the maximum data rate of
associated radios. The table displays a list of the top five
radios in terms of overall traffic utilization quality. It
displays the radio names, MAC Addresses and radio types for
each of the top five radios.
-
The Client
Traffic Utilization displays how efficiently
the RF medium is utilized for connected clients. Traffic
utilization is defined as the percentage of current
throughput relative to the maximum possible throughput for
the clients in the RF domain. The table displays a list of
the top five performing clients in respect to overall
traffic utilization. It displays the client names, MAC
Addresses and vendor for each of the top five clients.
-
The Wireless
Security displays the overall threat index
for the system. This index is based on the number of
Rogue/Unsanctioned APs and Wireless
Intrusion Protection System (WIPS) events detected.
The index is in the range 0 - 5 where 0 indicates there are
no detected threats. An index of 5 indicates a large number
of intrusion detection events or rogue/unsanctioned APs
detected.
-
The Traffic
Statistics includes transmit and receive
values for Total Bytes, Total Packets, User Data Rate,
Broadcast/Multicast Packets, Management Packets, Tx Dropped
Packets and Rx Errors.


