Radio RF Statistics
To view connected radio RF statistics:
- Select the Statistics menu from the Web UI.
- Expand the RF Domain node.
- Select a Wireless Controller.
- Expand the Radios node from the left-hand side of the UI.
- Select RF
Statistics.
The screen displays.
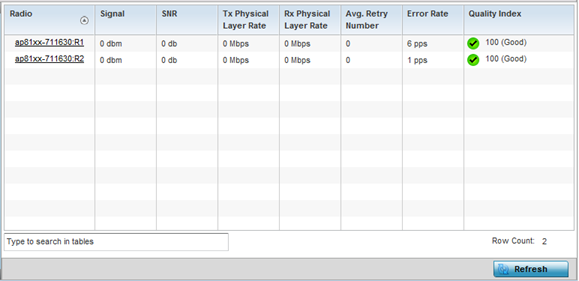
 The RF Statistics screen provides the following information:
Radio Displays the name assigned to each listed radio. Each radio name displays as a link that can be selected to display radio information in greater detail. Signal Displays the power of each listed radio signals in dBm. SNR Displays the signal to noise ratio of each listed radio. SNR is a measure that compares the level of a desired signal to the level of background noise. It is defined as the ratio of signal power to the noise power. A ratio higher than 1:1 indicates more signal than noise.
Tx Physical Layer Rate Displays the data transmit rate for each managed radio's physical layer. The rate is displayed in Mbps. Rx Physical Layer Rate Displays the data receive rate for each managed radio's physical layer. The rate is displayed in Mbps. Avg Retry Rate Displays the average number of retries for each radio. Error Rate Displays the average number of retries per packet. A high number indicates possible network or hardware problems requiring administration to improve performance. Quality Index Displays the client's RF quality. The RF quality index is the overall effectiveness of the RF environment, as a percentage of the connect rate in both directions as well as the retry rate and the error rate. RF quality index value can be interpreted as:
- 0 – 20 — very poor quality
- 20 – 40 — poor quality
- 40 – 60 — average quality
- 60 – 100 — good quality
- Click Refresh to update the screen's statistics counters to their latest values.

