Wireless LANs
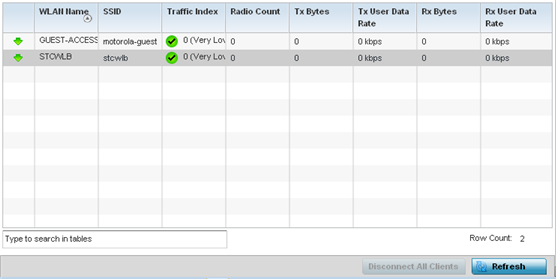
The Wireless LANs screen displays performance statistics for each WLAN managed by the controller or service platform. Use this information to assess if configuration changes are required to improve connected AP and client performance.
To view the wireless LAN statistics:
- Select the Statistics menu from the Web UI.
- Expand the RF Domain node.
- Select the Wireless Controller node from the left navigation pane.
- Select Wireless
LANs from the left-hand side of the UI.
The screen displays.

The Wireless LANs screen displays the following:
WLAN Name Displays the name of the WLANs the controller or service platform is currently utilizing for client connections and QoS segregation. SSID Displays the SSID each listed WLAN is using as an identifier on the wireless network. Traffic Index Displays the traffic utilization index, which measures how efficiently the traffic medium is used. It's defined as the percentage of current throughput relative to the maximum possible throughput. Traffic indices are: - 0 – 20 (very low utilization)
- 20 – 40 (low utilization)
- 40 – 60 (moderate utilization)
- 60 and above (high utilization)
Radio Count Displays the number of radios currently in use by device utilizing the listed controller or service platform managed WLAN.
Tx Bytes Displays data transmit activity (in bytes) on each listed WLAN. Tx User Data Rate Displays the average user data rate for packets transmitted by controller or service platform connected devices using this WLAN. Rx Bytes Displays the total number of bytes received on each listed WLAN. Rx User Data Rate Displays the average user data rate for packets received by controller or service platform connected devices using this WLAN. - Click Disconnect All Clients to terminate the all client WLAN memberships.
- Click Refresh to update the statistics counters to their latest values.

