AP Light Sensor
To view an AP 8132 model
access point‘s environmental light statistics:
- Select the Statistics menu from the Web UI.
- Expand the System
node from the navigation pane (on the left-hand side of the screen). The
System node expands to display the RF Domains created within the managed
network.
- Expand an RF Domain node, select a controller or service platform, and
select one of its connected access
points. The access point's statistics menu displays in the right-hand
side of the screen, with the Health tab selected by default.
- Select
Environment. The Statistics > AP 8132
> Environment > Light tab displays by default.
Additional
Temperature,
Motion and
Humidity tabs
available for unique sensor reporting. Each of these sensor measurements helps the
administrator determine whether the AP 8132's immediate deployment area is occupied by changes in the
access point's environment.
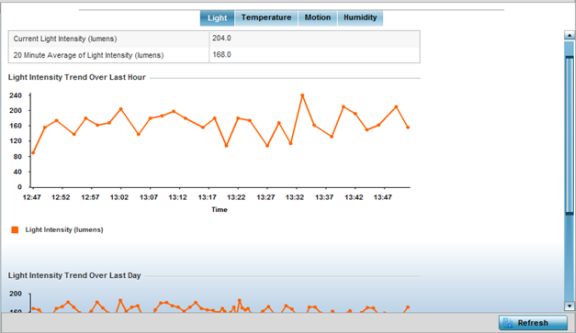
- Refer to the
Light table to assess the sensor's detected light intensity within the
AP 8132 immediate deployment area.
Light
intensity is measured by the sensor in lumens. The table displays the Current Light Intensity (lumens)
and the 20 Minute
Average of Light Intensity (lumens). Compare these two items to
determine whether the AP 8132‘s deployment location remains consistently lit, as an
administrator can power off the access point‘s radios when no activity is detected
in the immediate deployment area.
- Refer to the Light Intensity Trend Over Last
Hour graph to assess the fluctuation in lighting over the last hour.
Use this graph to assess the deployment areas light intensity of particular hours of
the day as needed to conjunction with the daily graph immediately below it.
- Refer to the Light Intensity Trend Over Last Day graph to assess whether lighting
is consistent across specific hours of the day. Use this information to help
determine whether the AP 8132 can
be upgraded or powered off during specific hours of the day.
- Select Refresh at any time to update the
screen‘s statistics counters to their latest values.