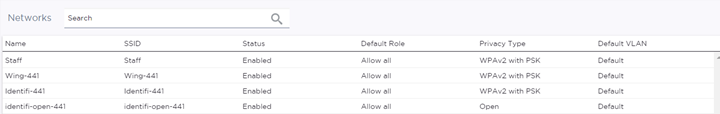
The page shows a list of all of your networks.
| Sites | View the list of associated sites. Select a site to open the configuration page. |
| Access Points | View the list of associated access points. Select an access point to open the configuration page. |
| Switches | View the list of associated switches. Select a switch to open the configuration page. |
| Clients | View a list of associated clients. Select a client to blacklist or whitelist the client. |
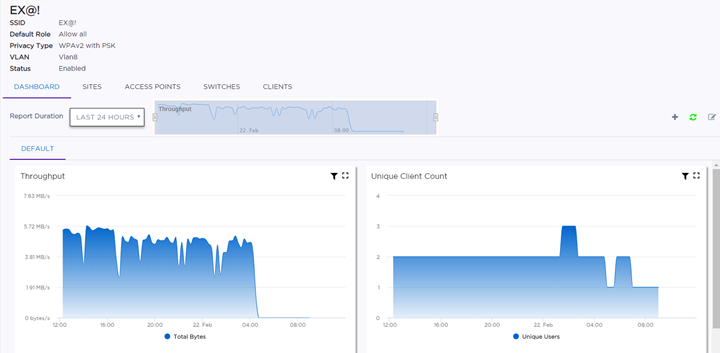
On the individual network Dashboard page, widgets show historical data that can help you determine a baseline and identify unusual activity.
These widgets provide information about usage patterns specific to an individual configured SSID/network. (Services include the type of wireless security, privacy filters, and RADIUS servers used, if any.) This information helps you to plan for scaling the network. Understanding the distribution of device types on the network can help to identify ancillary services that should be provided. For example, if the network has a high percentage of IOS devices, you may choose to enable Bonjour traffic controls.
The dashboard can be customized to use other available widgets, such as the distribution of device/OS types and applications over a period of time.
 Print
this page
Print
this page Email this topic
 Feedback
 View PDF
 Download EPUB