Use Topology Manager

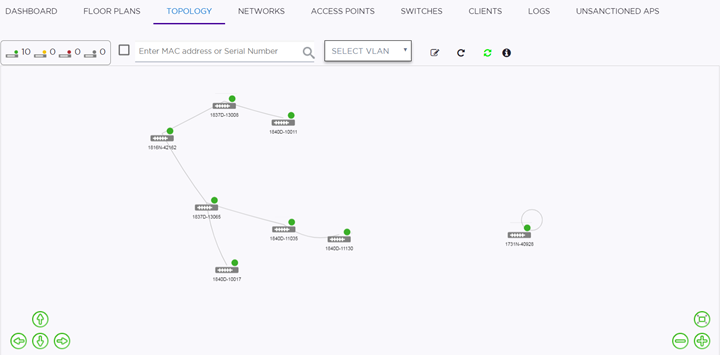
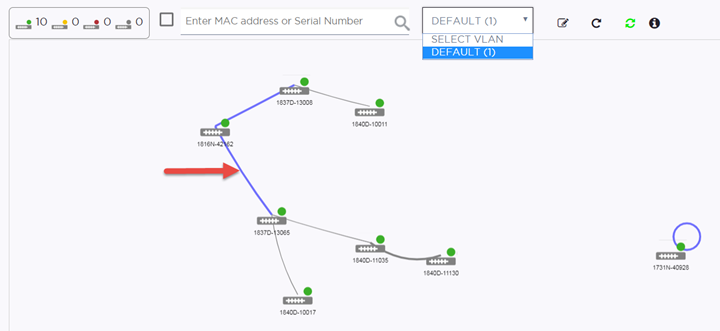
Topology Manager monitors the network topology state for physical devices, showing L2 switch interconnects and the end device connections to the switch. The data is displayed in the user interface using a physical layer diagram to show a switch and what is connected to each port. Zoom in and out to see the state of nodes and edge devices in a network.

To access and use the Topology Manager:
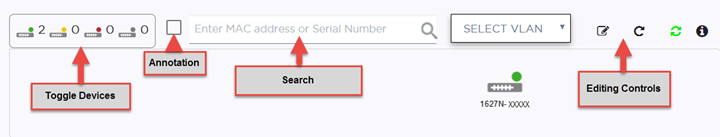
  1. Select Monitor > Sites. Select a site from the list, and select the Topology tab.
    The Topology page displays.
    Click to expand in new window
    Topology Manager - Site View
    GUID-8BA8AFF6-C07C-4BDE-9F50-61235508C95C-low.png
  2. Use the menu at the top to filter by or display specific criteria:
    Click to expand in new window
    Topology Menu
    GUID-1858ED12-C6A5-46CC-AFC5-A9AF22E33764-low.png
    Toggle Devices A graphic box displays a set of switches in different states, showing the number of switches in each state. Select the graphic box to toggle to a set of access points that show the number of access points in each state. The states are:
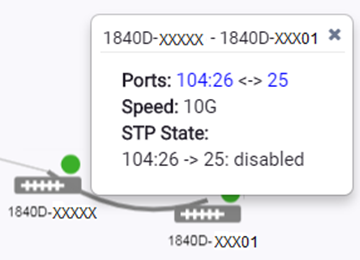
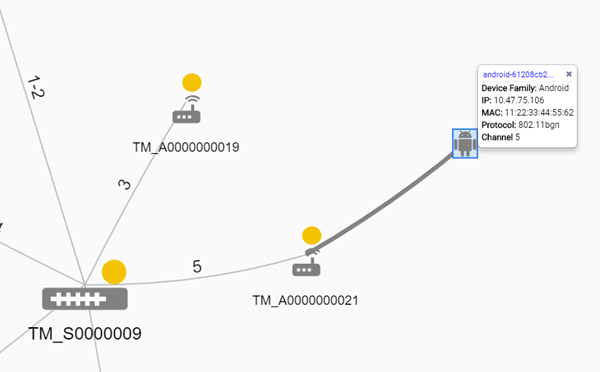
    • Green - In service
    • Yellow - Trouble
    • Red - Critical
    • Gray - Unknown
    Annotation By default, the Annotation checkbox is disabled. Select the checkbox to display the ports on the edge between devices in the topology diagram.
    Search Search by MAC address or by devices serial number.
    Select VLAN If available, select a VLAN to filter on in the current nodes that display. You can use this option at any level of the topology, such as site, switch, access point, or client.
    Editing Controls Lets you edit, save, undo, redo, and regenerate the map. To edit the nodes (icons), select Edit, then drag the nodes and select Save. The Refresh button refreshes the page.
  3. To view the APs, select + in the bottom right corner or use your mouse wheel to zoom in.
  4. (Optional) Select a device to display the device details, such as hardware type, serial number, and port information.
    Click to expand in new window
    Device Details
    GUID-A3BE9FBC-B93A-47C6-AD2F-37E6D4696A5A-low.png
  5. (Optional) Select the edge of a device to see detailed information about the links, such as ports, speed, and STP state.
    Click to expand in new window
    Link Information
    GUID-C394EADA-C63A-4514-90A3-8BE3F3CCCC36-low.png
  6. (Optional) Select a VLAN from the menu.
    Click to expand in new window
    VLAN Links
    GUID-71F68D0A-C15E-4C7C-9795-E45295A9AB30-low.png
    The paths between the devices are highlighted in purple.
  7. (Optional) To add a client to the map, search for the client‘s MAC address using the Search field. The client is added to the map with corresponding client type.
    Click to expand in new window
    Client MAC Details
    GUID-2F7C3CD1-3AA4-46D6-807D-E59551EC128A-low.png
  8. (Optional) To see a device (or client) statistics page, select the corresponding icon in the map.