| Floor Plans | Manage device placement and view heat maps, channels, link speed, and RFQI. Toggle between 5 GHz and 2.4 GHz radios. Add or remove badges. |
| Topology | View the site topology and drill down to see links between ports. |
| Networks | See the list of associated networks. Select a network to open the configuration page. |
| Access Points | See the list of associated access points. Select an access point to open the configuration page. |
| Switches | See the list of associated switches. Select a switch to open the configuration page. |
| Clients | See a list of associated clients. Select a client to blacklist or whitelist the client. |
| Logs | View and filter the list of event logs. |
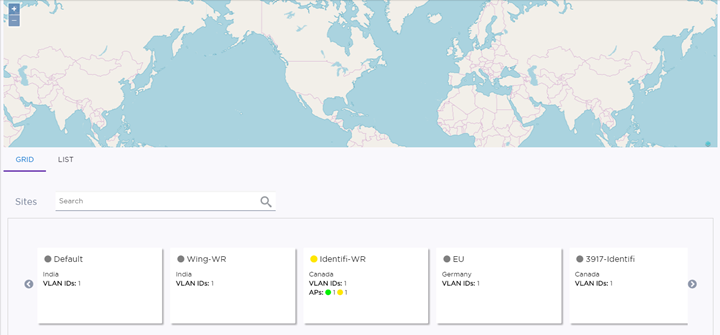
| Unsanctioned APs | If the site is an ExtremeWireless WiNG site, any unsanctioned APs are listed. You can filter the list. |
On the individual site Dashboard page, widgets show historical data that can help you determine a baseline and identify unusual activity.
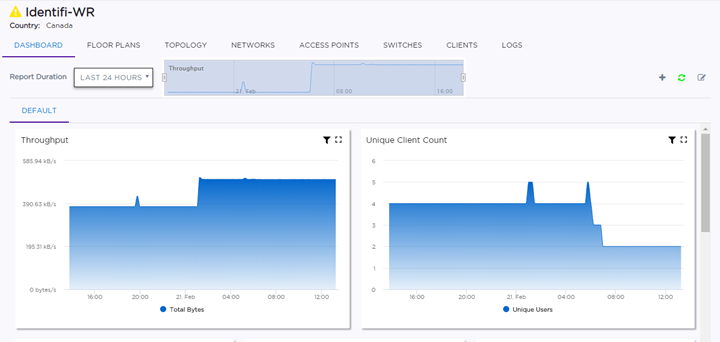
The dashboard can be customized to use other available widgets. For example, these widgets can include the following information:
 Print
this page
Print
this page Email this topic
 Feedback
 View PDF
 Download EPUB