You can customize the default dashboard views (main dashboard or entity dashboards) to fit your network's analytic requirements, such as monitoring the topology, component health, and device performance.
To customize any dashboard:
 .
.
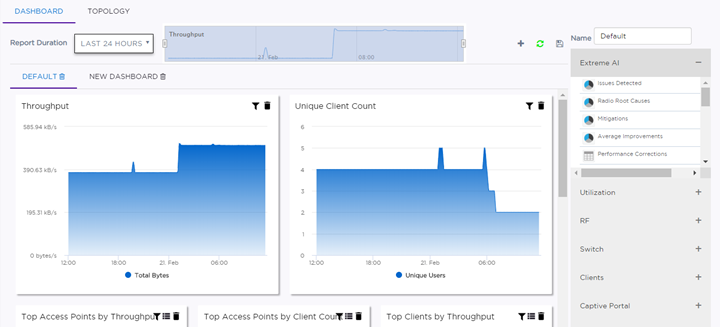
| Utilization | Provides utilization metrics such as client count, and various top 10 and bottom 10 counts. |
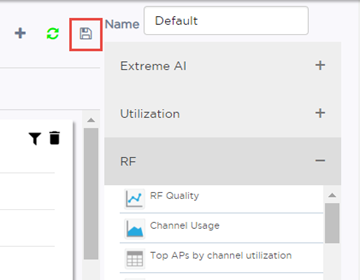
| RF | Provides Radio Frequency metrics such as RF quality, RF health, channel utilization, and various top 10 and bottom 10 metrics. This group also includes various Smart RF metrics. |
| Switch | Tracks top and bottom switches by throughput. |
| Clients | Tracks client distribution based on different parameters. |
| Captive Portal | Provides metrics regarding associated guests and the amount of time guests spend using the service. |
| Application Visibility | Provides application visibility metrics. |
 ) button.
 Print
this page
Print
this page Email this topic
 Feedback
 View PDF
 Download EPUB