Dashboard

The oveview Dashboard gives a holistic view of your sites. There are also dashboards available at the entity level for specific information about individual devices, roles, and so on.

When you log in, the overview dashboard displays by default. Navigate to this dashboard at any time by selecting Dashboard from the left menu.

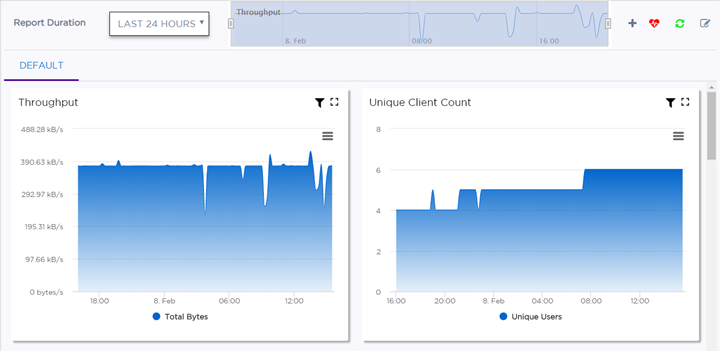
The overview dashboard displays widgets with system level data and dashboard controls.

The Widgets

The dashboard widgets help you proactively monitor your network or troubleshoot an issue, and display data at the system level. (There are also widgets available for the entity level dashboards.) The dashboard's physical layout is customizable and configurable.
Click to expand in new window
Dashboard
GUID-B6C73D24-4095-4D37-AC85-C5A0988B2D4C-low.png
The default dashboard displays the following widgets:
  • Throughput
  • Unique Client Count
  • Top Access Points by Throughput
  • Top Access Points by Client Count
  • Top Networks by Throughput
  • Top Clients by Throughput
  • Top Operating Systems by Client Count
  • Top Application Groups by Client Count
  • Top Application Groups by Throughput
  • Top Switches by Throughput

Summary data values greater than or equal to ten thousand (10,000) are displayed with the suffix K. For example, if the actual value is 11,215, then the displayed value will be 11.21K. Similarly, the widgets display a value with the suffix M for values over a million (1,000,000).

Use the dashboard widgets to determine where you need to access more detailed information. For example, looking at top access points by throughput, select a specific AP in the list at the bottom of the widget. The chart information will change to show the throughput for the selected AP, and the name of the AP turns gray. Select the AP again to display the information for all of the top access points (and the name of the selected AP turns black again). Use the widget controls to filter the widget, print data, and change the viewing size.
Click to expand in new window
Example of Widget
GUID-1B1BCF9B-9706-44BA-A82E-39202B76FEFD-low.png

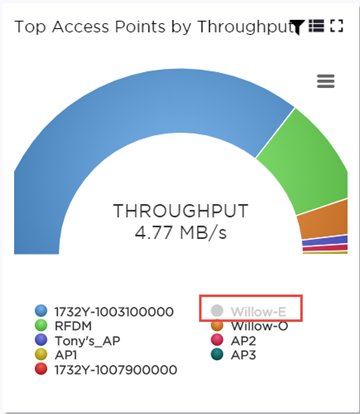
The dashboard widgets are classified according to the data they access. Categories include Utilization, Radio Frequency (RF), Switch, Clients, Captive Portal, and Application Visibility. Widgets from any of the categories can be combined to customize the dashboard layout.

Multiple dashboards can be created with different layout and widgets. A maximum of 32 dashboards can be created per customer account.

Widget Controls

Filter the data or change the view of a widget using the controls located in the top right of each widget. Not all controls are available for each widget. The following table describes the widget controls:

Click to expand in new window

Widget Controls

Widget Control Description
GUID-D80EFF82-75EE-4CA3-BC5E-C53F0D626258-low.jpg Enables the radio band filter on each chart. Then select the radio band to filter on: All, 2.4 GHz, or 5.0 GHz.
GUID-F5E181A9-FDAA-4335-B32B-D1A99F2CD447-low.jpg Enables sizing on each chart. Then select the same icon on any chart that you want to expand or reduce.
GUID-2DF3B72F-3EE9-47F6-A890-88CE95EF60EA-low.jpg Lets you toggle between displaying the data as a grid, a graph, or both. Not available for all charts.

Report Duration

The dashboard widgets let you filter data based on time duration. Select the report duration from the drop-down menu or use the slider at the top of the dashboard page.

Click to expand in new window
Report Duration
GUID-0C83140D-63EE-4E92-9F70-6CAC15243AD9-low.png
The values in the drop-down menu are:
  • Last 8 Hours
  • Last 24 Hours
  • Last 7 Days
  • Last 31 Days

Dashboard Controls

You can see which devices are in critical, in service, and in trouble states by doing the following actions:
  1. Select the Network Health icon. The number of access points and switches in each state displays.
  2. To drill down to specific device information, select a category. The specific site and device information displays.
The dashboard controls also let you add or edit a dashboard, and refresh the view.
Click to expand in new window
Network Health Pane and Dashboard Controls
GUID-3B786442-9F6E-4D8B-8E9B-35D8C727A3AB-low.png
Click to expand in new window

Dashboard Control Descriptions

Dashboard Control Description
GUID-767A207D-113C-4925-8F8E-CA2B5280DF25-low.jpg Adds a customized dashboard.
GUID-40411D52-0659-45AD-892C-F4373878D3A9-low.jpg 
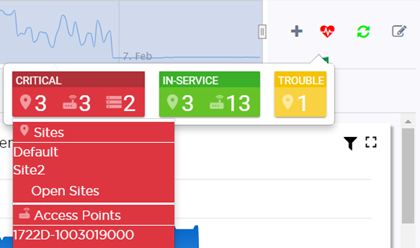
Indicates the network health. Lets you drill down to see which devices are in Critical, In Service, or Trouble states.
  • Green - The network is healthy.
  • Red - The network has an issue.
GUID-075E1E41-0F39-4C7D-8E1B-CA1EEE29D955-low.jpg Refreshes the dashboard data.
GUID-15E4D8B2-554B-44B3-AE94-61729634B616-low.jpg Customizes the dashboard by adding or removing widgets.